Beginner Binary Options Strategy #1
In this edition, I'd be teaching you two simple and efficient binary options strategy. The first strategy isn't named, but it has been accurately proven on several occasions in Binary Options trading. This strategy requires the use of indicators and a number of 4 different indicators. And it promises a winning ratio of 70% most times(provided you execute accurately). I'd explain the full description below as well as tips regarding its applicability.
This strategy majorly predicts the future movement of an asset using the data supplied by 4 financial trading indicators(which will be mentioned below). It is also necessary to understand what these indicators precisely are to be able to put them into full use(I might put up a little description on them soon).
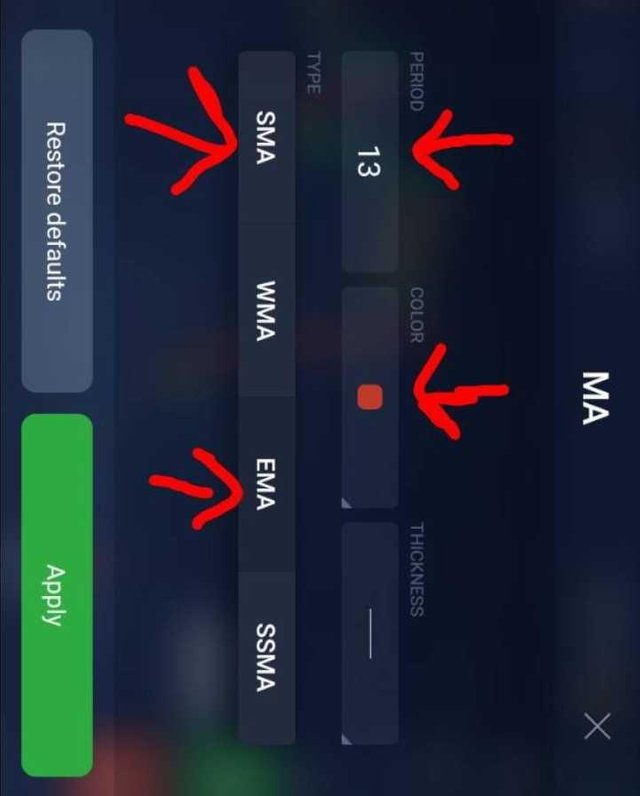
The Indicators are;
13 Exponential Moving Average(EMA)
20 Simple Moving Average(SMA)
26 Exponential Moving Average(EMA)
(These three indicators are represented by three lines moving around on the charting platform which represents the value of the asset itself)
Bollinger Band
The Bollinger band is represented by two lines. The mid of these lines is the average position of the 3 above mentioned indicators. So, the Bollinger band has two boundaries, an upper boundary and a lower boundary in which the remaining 3 indicators are positioned.
A view of Indicators setup below on a charting platform
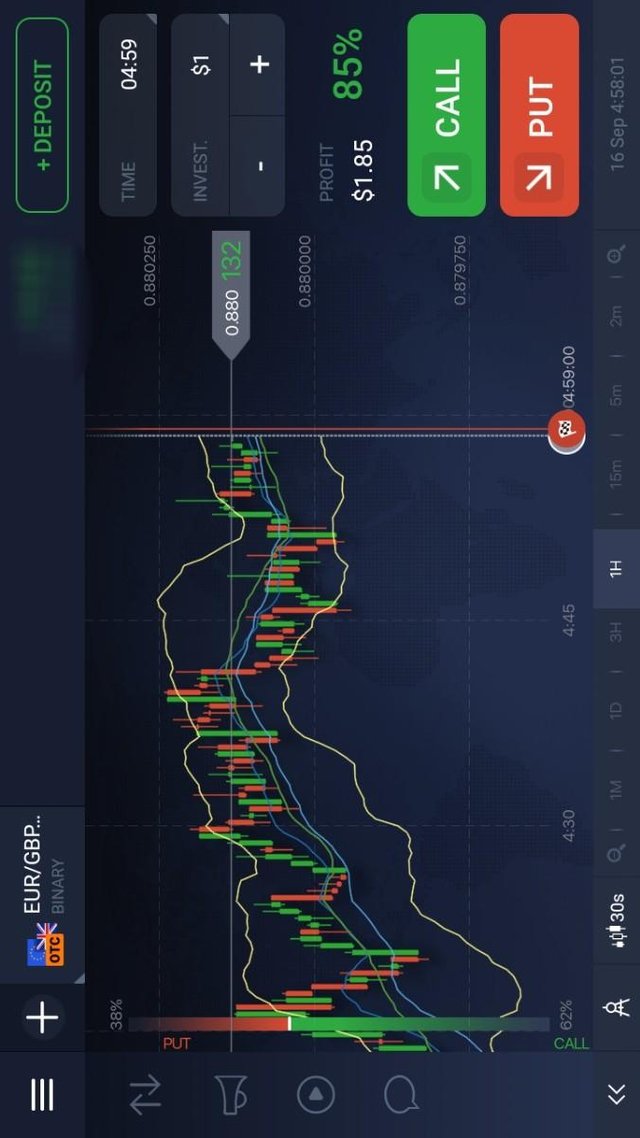
HOW TO USE:
Let's talk about the strategy. As I explained above, with this strategy, you'd be able to predict the future movement of an asset. So, to use, you'd activate on your interface first.
Things you have to watch for:
The 13 Exponential Moving Average(EMA) will cross the 20 Simple Moving Average(SMA)
The 26 Exponential Moving Average(EMA) will cross the 20 Simple Moving Average(SMA) after which it will then cross the 13 Exponential Moving Average(EMA)
If the above conditions have been met, then, on most occasions will the following happen:
The asset's value will go outside one of the Bollinger Bands boundaries.
You therefore will be able to know which boundary the asset will cross based on the general directional movement of the three indicators mentioned above.
If in average the three Moving Average indicators move up, then the Bollinger Bands upper boundary will be broken by the asset. Also, If in average the three Moving Average indicators move down, then the Bollinger Bands lower boundary will be broken by the asset.
The above outlined scenario will happen around 80%-90% of the trading time, this is a lot, but it also implies that there'd be cases when this prediction will be incorrect, so do not assume this is the 'bomb' or a 'sure-win'. "sure-win" strategies do not exist, so do not be deceived.
Practise on the first step frequently and get used to the indicators with time.
Next Post I'd be putting up will be on good applicability of this strategy... Anticipate...
Put comments below and I'd be ready to interact...

Nice one
So on point bro, kip it up
Well done
Binary options have nothing to do with investing, it's just the same like gambling.
I have wrote a post about it:
https://steemit.com/business/@niel96/fkheawcex