Learn Python Series (#17) - Roundup #2 - Combining and analyzing any-to-any multi-currency historical data
Learn Python Series (#17) - Roundup #2 - Combining and analyzing any-to-any multi-currency historical data
![]()
What Will I Learn?
- You will learn how to load (deserialize) previously fetched, converted and stored JSON data containing historical USD prices and timestamps for various coins;
- how to plot the historical USD pricing data per coin (using Matplotlib);
- how to think differently regarding the perceived value of individual crypto assets, seen from an any-to-any price ratio;
- how to merge and convert list data from two coins into a merged historical price ratio, plot that, and make (basic) conclusions regarding trends apparently nobody seems to be watching!
PS: This Learn Python Series episode will combine previously addressed Python techniques in an effort to "think different" and "out of the box". So from a learning point of view, this episode has multiple layers of information (technical, financial, mathematical, creative thinking).
Requirements
- A working modern computer running macOS, Windows or Ubuntu
- An installed Python 3(.6) distribution, such as (for example) the Anaconda Distribution
- The ambition to learn Python programming
Difficulty
Intermediate
Curriculum (of the Learn Python Series):
- Learn Python Series - Intro
- Learn Python Series (#2) - Handling Strings Part 1
- Learn Python Series (#3) - Handling Strings Part 2
- Learn Python Series (#4) - Round-Up #1
- Learn Python Series (#5) - Handling Lists Part 1
- Learn Python Series (#6) - Handling Lists Part 2
- Learn Python Series (#7) - Handling Dictionaries
- Learn Python Series (#8) - Handling Tuples
- Learn Python Series (#9) - Using Import
- Learn Python Series (#10) - Matplotlib Part 1
- Learn Python Series (#11) - NumPy Part 1
- Learn Python Series (#12) - Handling Files
- Learn Python Series (#13) - Mini Project - Developing a Web Crawler Part 1
- Learn Python Series (#14) - Mini Project - Developing a Web Crawler Part 2
- Learn Python Series (#15) - Handling JSON
- Learn Python Series (#16) - Mini Project - Developing a Web Crawler Part 3
Learn Python Series (#17) - Roundup #2 - Combining and analyzing any-to-any multi-currency historical data
In the previous Learn Python Series episode, we learned how to use web crawling techniques to fetch, reformat and store historical price data (we stored the daily opening prices) on BTC, Steem and SBD via requests, bs4 and JSON serialization. In this episode we are going to further process, combine and analyze those stored .json files to see if we might be able to conclude some interesting things regarding BTC, Steem and SBD.
For example, everybody can simply visit a website such as coinmarketcap.com, check out the current and historical price data on, e.g. BTC, Steem and/or SBD (presented as USD values over time). However, did you ever think for a moment about how and / or why any-to-any multi-currency historical data is missing? Of course it's interesting to "just check" the current USD value of Steem, and see how it has evolved over time. But where in the world can you buy or sell Steem for USD directly? Or SBDs for USD directly?
On crypto markets, you must first buy BTC, then trade that for Steem and / or SBD to acquire a Steem or SBD holding. And the other way around, in order to sell your hard-earned Steems and / or SBDs, you again must first find a tradeable market pair (e.g. BTC-Steem, BTC-SBD) befoe being able to convert to fiat.
And if that's the case, which it is, why directly compare Steem to USD, or SBD to USD? Isn't it far more interesting to analyze the BTC/Steem and BTC/SBD ratios over time, since it's BTC that forms the "gateway / bridge" between Steem, SBD to fiat and vice versa?
Nota bene: without me covering it explicitely, after following this tutorial episode, would you be interested in, and able to, generate - for example - data and charts for the Steem/Litecoin ratios? Or how does Ripple relate to EOS? Or... any, to any? Would that be interesting to know about? And do you know a place on the web where that data is readily availble?
Interesting huh? ;-) And cool as well! Let's dive right in to see what we can come up with to accomplish exactly that!
Plotting the already stored historical JSON data
In case you followed along my entire Learn Python Series episodes, you must have read about the plotting library Matplotlib which was first covered by me in the Learn Python Series (#10) - Matplotlib Part 1 episode. In case you haven't read that one already: Matplotlib is an external plotting library, allowing you to plot a lot of different charts, such as bar charts, (scatter) plots, histograms, spectra and many more, and as a natural consequence it's well-suited to plot financial data as well.
Nota bene: you can read about how to install Matplotlib in Learn Python Series (#10) - Matplotlib Part 1 as well, I already covered that!
Plotting the BTC/USD, Steem/USD and SBD/USD data to chart
In the previous episode we did (correctly) store the CMC web-fetched financial data, via serializing the converted dictionary data to regular JSON, but in order to "be really sure" it's always a good idea to visualize your data, for example by plotting it via Matplotlib. You can then visually check to see if the data seems to be okay.
In order to do so:
- first import json and matplotlib.pyplot;
- create a
currency_fileslist of files stored (you could also read all files names from the current working directory, but let's not make it too complex for now); - for each coin in the
currency_fileslist... - open its .json file, deserialize it using the
load()json method; - create an empty list for the dates and prices (Y-axis) on the plot, and append (after converting the price data to a float instead of a string) each daily tick to the list;
- configure a suitably large plotting figure, a Y-label (for USD prices) and a chart title (again using the .json file name for simplicity);
- and plot it!
import json
import matplotlib.pyplot as plt

currency_files = ['bitcoin_usd', 'steem_usd', 'steem-dollars_usd']

for coin in currency_files:
    file_name = coin + '.json'
    with open(file_name, 'r') as f:
        ticks = json.load(f)

    date_list = []
    price_list = []
    for tick in ticks:
        date_list.append(tick['date'])
        price_list.append(float(tick['open_price_usd']))

    fig, ax = plt.subplots(1, figsize=(15,7))
    ax.plot(date_list, price_list)
    plt.ylabel('USD ($)')
    plt.title(coin + ' ratio')
    plt.xticks([])
    plt.show()
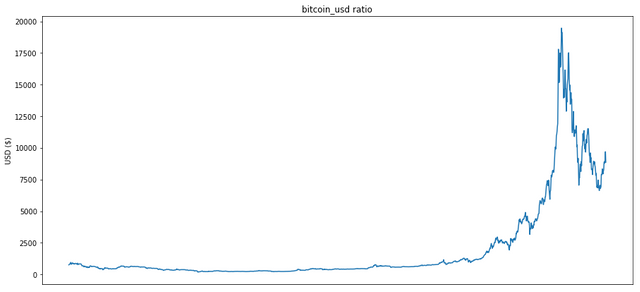
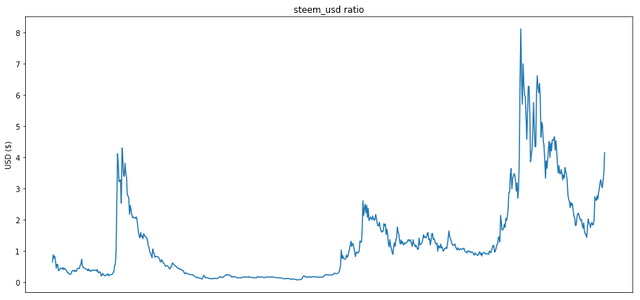
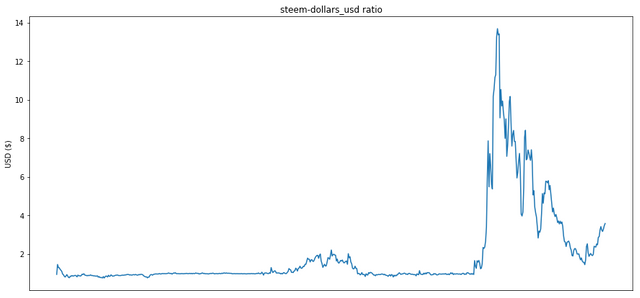
All three plots, BTC/USD, Steem/USD and SBD/USD, containing only daily opening prices, seem to look just fine. If we're looking at the utmost right-end side of each plot, the "very recent" prices, all three charts seem to be heading in an upward "Bullish" direction, which is pretty nice when you're holding any (or all) of these three coins as assets in your crypto portfolio after the downfall of the past +/- 3 months!
However... since everything seems to be going up right now, what can be said regarding "the most interesting" option?
Let's now calculate, save and plot the historical BTC/Steem and BTC/SBD ratios from the existing BTC/USD, Steem/USD and SBD/USD data:
(1) BTC/Steem ratio
How does BTC price relate to Steem price over time?
import json

with open('bitcoin_usd.json', 'r') as f:
    btc = json.load(f)

with open('steem_usd.json', 'r') as f:
    steem = json.load(f)

btc_steem = []

for btc_tick in btc:
    for steem_tick in steem:
        if btc_tick['date'] == steem_tick['date']:
            btc_steem_tick = {
                'date': btc_tick['date'],
                'ratio': ( float(btc_tick['open_price_usd']) / float(steem_tick['open_price_usd']) )
            }
            btc_steem.append(btc_steem_tick)
            continue

file_name = 'btc_steem.json'
with open(file_name, 'w') as f:
    json.dump(btc_steem, f, indent=4)
import matplotlib.pyplot as plt

with open('btc_steem.json', 'r') as f:
    ticks = json.load(f)

date_list = []
price_list = []
for tick in ticks:
    date_list.append(tick['date'])
    price_list.append(tick['ratio'])

fig, ax = plt.subplots(1, figsize=(15,7))
ax.plot(date_list, price_list)
plt.ylabel('Ratio')
plt.title('BTC/Steem')
plt.xticks([])
plt.show()
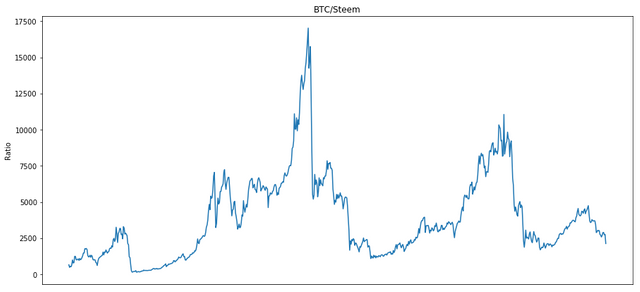
Concluding: regardless the precise current USD value for either BTC or Steem, in case you're interested in acquiring BTC from your Steem holdings, now could be an interesting time to convert from Steem to BTC, because the BTC/Steem ratio is pretty low (yesterday, April 26, 2018, only 2136 Steem was needed to acquire 1 BTC).
(2) BTC/SBD ratio
How does BTC price relate to SBD price over time?
import json

with open('bitcoin_usd.json', 'r') as f:
    btc = json.load(f)

with open('steem-dollars_usd.json', 'r') as f:
    sbd = json.load(f)

btc_sbd = []

for btc_tick in btc:
    for sbd_tick in sbd:
        if btc_tick['date'] == sbd_tick['date']:
            btc_sbd_tick = {
                'date': btc_tick['date'],
                'ratio': ( float(btc_tick['open_price_usd']) / float(sbd_tick['open_price_usd']) )
            }
            btc_sbd.append(btc_sbd_tick)
            continue

file_name = 'btc_sbd.json'
with open(file_name, 'w') as f:
    json.dump(btc_sbd, f, indent=4)
import matplotlib.pyplot as plt

with open('btc_sbd.json', 'r') as f:
    ticks = json.load(f)

date_list = []
price_list = []
for tick in ticks:
    date_list.append(tick['date'])
    price_list.append(tick['ratio'])

fig, ax = plt.subplots(1, figsize=(15,7))
ax.plot(date_list, price_list)
plt.ylabel('Ratio')
plt.title('BTC/SBD')
plt.xticks([])
plt.show()
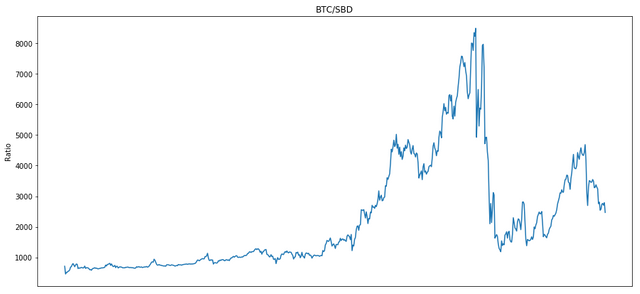
Concluding: SBD price seems to be lagging a little bit over Steem price, as compared to BTC. The BTC/SBD ratio is still in a downtrend, ergo if you're in the market for BTC and you're a firm holder of SBDs, converting right now could be "OK-ish", but it might be worth to wait for a few more days or weeks or so; at least keep on watching how the BTC/SBD ratio will develop the coming days!
What did we learn, hopefully?
In this episode, I showed you how to plot the previously generated historical USD data for BTC, Steem and SBD. And then, I showed you a way to gather completely different insights about the "value" of crypto currencies, by looking at "different" historical data which is derived from the USD-plots.
I wanted to show to you, another way of looking at data we (presumably) look at every day.
Question: did this Learn Python Series episode perhaps change your perception of what to "HODL" when exactly?
See you in the next episode!
Thank you for your time!
Posted on Utopian.io - Rewarding Open Source Contributors
The contribution is reviewed and approved.
This part of the series is as instructive as others, the quality is appreciated. Even though the content related with the project is not that much or directly concerned, the idea and approach makes this one a good contribution.
Need help? Write a ticket on https://support.utopian.io.
Chat with us on Discord.
[utopian-moderator]
Thanks!
Hey @roj, I just gave you a tip for your hard work on moderation. Upvote this comment to support the utopian moderators and increase your future rewards!
NICE LEARNING PROJECT
thanks! ;-)
Yes man
its great for all
thank yiu for sharing dear. u did well i like it.
@scipio
Right @moon-girl
This post is right on time, I’ve been wanting to teach myself python and was going to create a course for myself to self pace through (I work in highered publishing). But, this is way better! I’ve got some catching up to do though so I’m going to start with your intro post. Btw I don’t know why I never considered analyzing the coin to coin ratios! Lightbulb! Lol! Thank you!!!
Well good! Then you are exactly the (kind of) person I'm writing my whole
Learn Python Seriesincluding this episode for! And this is just the beginning; expect way more episodes!Nice to meet you by the way!
Nice to meet you also and thank you SO much for the generous upvote! I’m starting on the intro one now, I’ll keep you posted! This is seriously exactly what I was needing! Thank you again for putting all of this together it’s definitely a lot of great hard work on your part! 😊
There, another one then ;-)
This post has been upvoted and picked by Daily Picked #37! Thank you for the cool and quality content. Keep going!
Don’t forget I’m not a robot. I explore, read, upvote and share manually ☺️
Upvote and Comment DONE💯✅
Please upvote my post: https://steemit.com/photography/@itzrafi/hidden-sun#comments
Follow me for more Upvote
Wowie Wowie Wowie! Thanks!
very informative post boss, u are to the moon @scipio
Hey @scipio! Thank you for the great work you've done!
We're already looking forward to your next contribution!
Fully Decentralized Rewards
We hope you will take the time to share your expertise and knowledge by rating contributions made by others on Utopian.io to help us reward the best contributions together.
Utopian Witness!
Vote for Utopian Witness! We are made of developers, system administrators, entrepreneurs, artists, content creators, thinkers. We embrace every nationality, mindset and belief.
Want to chat? Join us on Discord https://discord.me/utopian-io