Support and Resistance Breakouts - Crypto Academy / S6W3 - Homework post for pelon53.
Good day, crypto enthusiasts. This is my presentation of the homework task assigned by professor @pelon53 on support and resistance breakouts. Let's get started!
1.- Explain in detail the advantages of locating support and resistance on a chart before trading.
Support and resistance levels play a very important role when it comes to technical analysis. They show us points on the chart where a trend has a higher potential of reversing. When the price of an asset is ranging or declining and it hits a support level, there is a higher probability of the price reversing in the upward direction. Also, if the price is ranging or in an uptrend and it hits a resistance level, there is a higher chance of the trend reversing. However, if the trend is not able to reverse at this point but rather breaks it, then it is expected to continue in the direction it was moving in.
This means that the support and resistance levels are generally points on the chart that traders perceive to be difficult to break. There is a higher chance of the price acting at these levels as expected because this is a basic belief of almost every trader, and the psychology of the traders plays a very important role as they keep the market running. They usually set their entry and exit positions at the support and resistance levels, and if you are able to identify these levels correctly, the market is expected to act accordingly and it will increase your profitability.
The more traders of a particular asset who trade based on the support and resistance levels, the higher the probability of the trend acting as expected at these levels.
Therefore, if you are able to identify the support and resistance levels before trading, there is a high probability that the price will act at these levels as expected, following the psychology of traders, and this will help increase your win rate in all trades you make.
2.- Explain in your own words the breakout of support and resistance, show screenshots for the breakout of a resistance, use another indicator as a filter.
The breakout of support and resistance levels gives very important signals to traders as it signals trend continuation. This is because the support and resistance levels are points where the majority of traders set their entry and exit positions. There are several chart patterns traders can use to get a signal of a breakout, and the most common ones include wedges, ranging charts, head and shoulders, flags, triangles, and others.
In most cases, the price may falsely return to the support or resistance level before moving back to the trend direction with higher volume, or it may not even move back to the trend breakout direction, in which case the breakout is regarded as a false breakout. That is why it is always a good practice to use other indicators like moving averages, MACD or any of the momentum-based indicators to increase the strength of the signal.
Breakout of Resistance Level.
If the market is consolidating, it means that market participants are currently in an indecision phase and if the price is able to break the close resistance level, it is expected to continue in an uptrend. This is known as a breakout of the resistance level.
Moreover, in a consolidating trend or an uptrend, there are loads of exit positions (take profit for longs or take profit for shorts) at the various resistance levels. Hence, if the price hits any of these levels, it is likely to reverse. However, if it is able to break this level, it means the buying power is strong enough and new buy entry orders are set to increase the buying pressure to keep the price in an uptrend. The breakout could be a false one; hence, it is always required to confirm the breakout with other factors before taking a position.
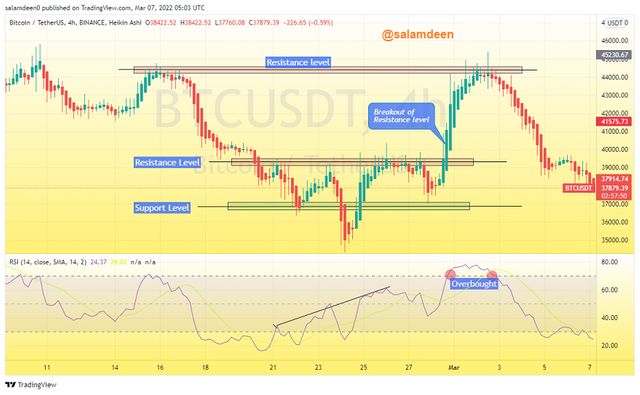
Breakout of resistance level |Screenshot from tradingview.com
Considering the BTC/USDT 4 hour timeframe chart above, the price was consolidating between 37k and 39k price levels. I added the RSI indicator and it showed a bullish divergence and the oscillator was ranging around the overbought zone when the price broke the resistance level. Here, the breakout of the overbought zone signals a resistance breakout, especially when the chart is in ranges. As the price broke the resistance level near 39k, there was an uptrend to the next resistance level.
3.- Show and explain support breakout, use additional indicator as filter, show screenshots.
Breakout of Support Level.
If the price reaches this level, there is a high probability of a reversal; if it fails to reverse and continues the trend, this is regarded as a breakout of the support level, which indicates that there is more selling than buying and stop loss orders are triggered to increase the selling pressure; the trend is expected to continue in a downtrend.
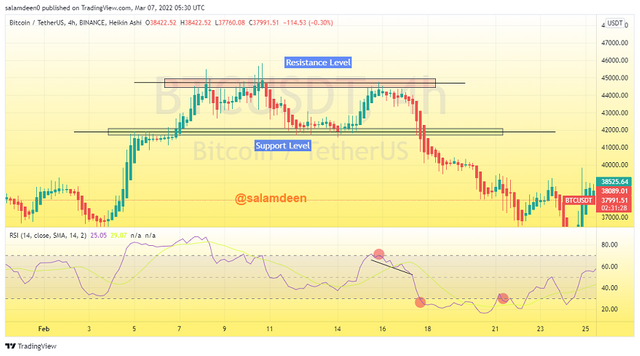
Breakout of support level | Screenshot from tradingview.com
In the BTC/USDT 4-hours timeframe chart above, the price was consolidating between the 42k and 45k price levels. With the RSI indicator, there was a bearish divergence and the oscillator was within the oversold zone, indicating that, there is currently more selling in the market. When the price is ranging, the break into the oversold zone can give a signal of a support breakout. As the price broke the support level near 42k, there was a downtrend.
Q4.-Explain what a false breakout is and how to avoid trading at that time. Show screenshots
A false breakout occurs when the price line breaks a support or resistance level but fails to move in the direction of the breakout but rather retests the opposite direction. This lures most traders, who act quickly without enough confirmation, to enter or exit the market at the wrong time. A false breakout can be caused by a variety of factors; therefore, it is always best to wait for the formation of multiple candles to confirm the breakout.
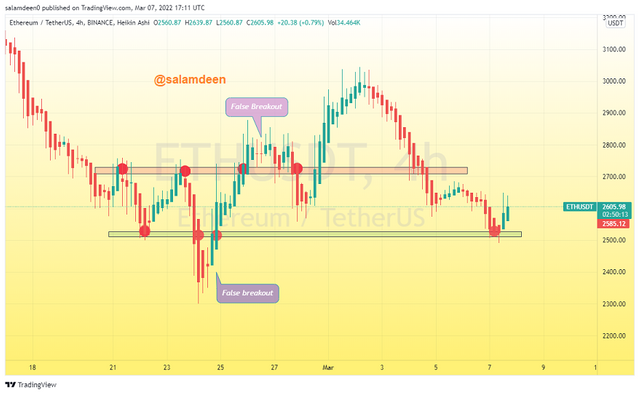
False Breakout | Screenshot from tradingview.com
The chart above is the ETH/USDT 4 hour timeframe chart, It can be seen that, the price retested after the breakout on two occasions. The first one occurred on February 24 when the price broke the support level with the formation of two strong bearish candles, but the price was able to continue in the direction of the breakout as it retraced above the support level again. The second false breakout occurred on the next day, February 25th, as the price broke the resistance level and retraced below it again before a real breakout.
How to avoid trading at False Breakout
Many factors lead to the occurrence of false breakouts. The most common factors include volume and market sentiment. Traders are always required to trade with patience by waiting for the formation of multiple strong candles to increase the signal. It is also important to keep a close observation of the trading volume as the price breakout occurs. For a real breakout, the volume will be high.
This means that if the price breaks a support or resistance level with lower volumes, it could easily retrace against those who panic entered the market without enough confirmation. The momentum and volume based indicators can be added to filter the signal. It is also necessary to place a stop loss just below the resistance level in long trades or above the support level in short trades. This will help reduce the risk when the breakout turns out to be fake.
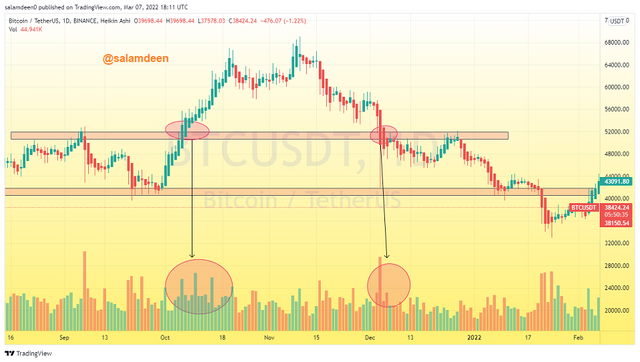
Screenshot from tradingview.com
As seen in the BTC/USDT daily timeframe chart above, there are real breakouts at the points with higher volumes.
Q5. - On a demo account, execute a trade when there is a resistance breakout. Do your analysis. Screenshots are required.
I executed a buy trade with the DOTDOWN/USDT pair on tradingview.com. As seen in the screenshot below, there was a break of the resistance level. The trading volume was also observed to be high, and the RSI oscillator was ranging in the overbought zone, indicating there is currently strong buying under higher volume. Hence, the price is expected to continue in the breakout direction. My entry was set near the breakout with my stop loss just below the resistance level and the take profit was set with the 1:2 risk reward ratio.
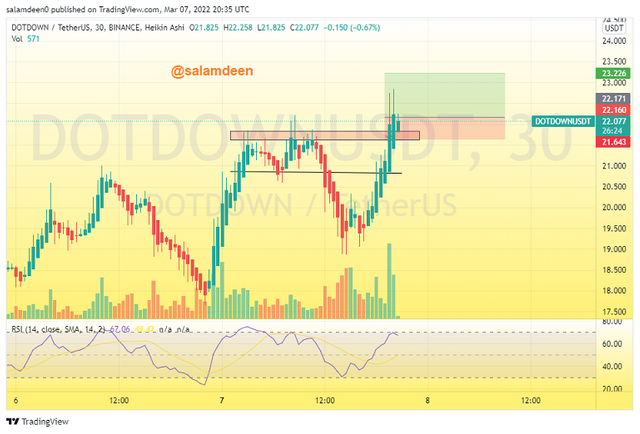
DOTDOWN/USDT 30 minutes timeframe chart Screenshot from tradingview.com
The Executed Order

Screenshot from tradingview.com
6.- In a demo account, execute a trade when there is a support break. Do your analysis. Screenshots are required.
I executed a sell trade with the MBOX/USDT pair on tradingview.com. The price was able to break a major support level, and I then waited for confirmation of the breakout. After the formation of multiple bearish candles, I observed the volume and it was seen to be trading at higher volume and the RSI was ranging in the oversold zone. All these are bearish signals, I then set my entry after the confirmations. The stop loss was set just above the broken support level and the take profit was also set with a risk-reward ratio of 1:2.
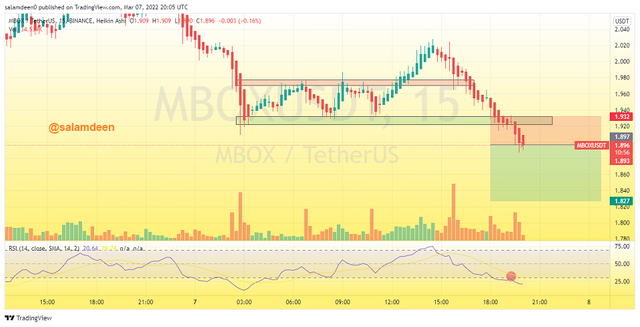
MBOX/USDT chart Screenshot from tradingview.com
The Executed order

Screenshot from tradingview.com
Conclusion
A breakout of support and resistance levels gives a signal about the possible direction of the price. However, if the breakout is rejected, it is regarded as a false breakout. It always requires patients to wait for confirmation of the breakout. This will help reduce the chances of losing as a victim of a false breakout. There are many other technical indicators that we can use to increase the strength of the signal.
By reading through the lecture by prof @pelon53 and participating in the homework task, I have realized how important it is to take into consideration the trading volume when dealing with the breakout of price actions. I want to thank professor @pelon53 for this knowledge. I can't wait for the continuation of this lecture.
Thank you.
