[Psychology of Trends Cycle] - Crypto Academy / S6W4- Homework Post for @reminiscence01
The presentation of my homework task was assigned by professor @reminiscence01 after a lecture on the psychology of trend cycles. Let's get started!

Cover

Explain your understanding of the Dow Jones Theory. Do you think the Dow Jones Theory is important in technical analysis?
Charles Dow's Theory
Theory, in simple terms, can be referred to as a system of rational ideas or propositions that intends to explain a particular phenomenon. The Dow theory is a popular theory in the financial sector and was derived by a market analyst named Charles H. Dow in the 1980's. This theory is about the nature of the market and involves six principles. The theory was developed based on price actions, behaviors of market participants, market speculation, and many other important factors.
The theory explains that the market has three significant trends. These include an uptrend, a downtrend, or a ranging market. The three states of the market can further be classified into primary, secondary, and minor trends, and this classification is based on the duration of the trend. Primary trends can be uptrends or downtrends that last from months to years. Secondary trends can be uptrends or downtrends that last from months to years. trends, on the other hand, can be viewed in days to a few months, and finally, the minor trends are the daily, hourly, or weekly variations of the market.
According to the theory, the market will always be in a trend until a major factor occurs in the market to affect the trend. The theory further explains that there are some phases in the primary trends that exhibit the behavior of the market participants and that the market does react to some information. There are a few other important points explained in the theory, including the idea that the action of volume confirms trends.
This theory is very necessary for technical analysis. The primary goal of every technical analysis is to identify the state of the market and anticipate the next move. The principles stated in the Dow Jones theory will be required at this point, and this will help build the fundamental blocks of the analysis. It is good to know that the idea of support and resistance and other price actions are all explained in the theory, and they all offer greater help in technical analysis than even the technical indicators, as they depict the real price action. Even before the emergence of modern day charting tools for technical analysis, traders were using knowledge of the Dow Theory for profitable trades. With all these, I think the knowledge of Dow Jones's theory will be of great help to every trader.
In your own words, explain the psychology behind the accumulation and distribution phases of the market. (Screenshots required).
Market participants can broadly be classified into two groups: those with strong hands and those with weak hands. This is a classification based on the value of their investment and how they react to market happenings. The strong hand represents the institutional investors who have very high purchase power, which is enough to have an impact on the market. Because of this, they have very high confidence in their investments. The weak hands, on the other hand, represent retail investors. They have low confidence in their investment and, hence, are mostly affected by market manipulations because their capital is small in relation to the total market cap of the asset. It is very necessary to know how the strong hands/institutional investors enter and exit the market as it will help retail inventors set up their positions in line with the strong hands.
Accumulation phase
The technique by which the strong hands acquire their assets at the lowest price without affecting the general market is termed "accumulation." This is usually the period of buying by the strong hands. During the accumulation phase, the market trend is sideways, and the breakout of the accumulation is an indication of an uptrend.
The strong hands use the concept of demand and supply and the Dow Jones theory to lure most of the market participants. As long as the price continues a trend unless it is affected by an event, At the accumulation phase, the strong hands usually set their buy orders at higher prices. This will attract the attention of most of the small investors and the retail traders as it will drive the price high.
With fear of missing out, most of the weak hands will be triggered to take some profits by opening sell orders. The strong hands will then use this as an opportunity to close their positions with some profits. The strong hands trade with higher volume due to the strength of their investment. This will lower the price and they will use it as an opportunity to take hold of more liquidity, which they will then use to set up bullish positions to drive the prices higher.
As the price starts to accelerate, most of the weak hands who react quickly to the market activity will start closing their sell positions with a loss in order to catch up with the trend by buying back. This will increase the demand for the asset, and more buyers will be attracted to the market by the high trading volume. If the volume is high enough, it will drive the price higher to break the sideways trend in the upward direction as the price will keep accelerating. Strong hands may decide to take smaller profits at some point by slowing down the market, and this phase can be termed the "re-accumulation phase."
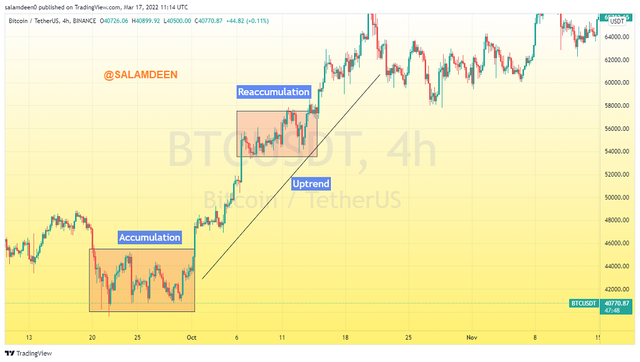
Screenshot from tradingview.com
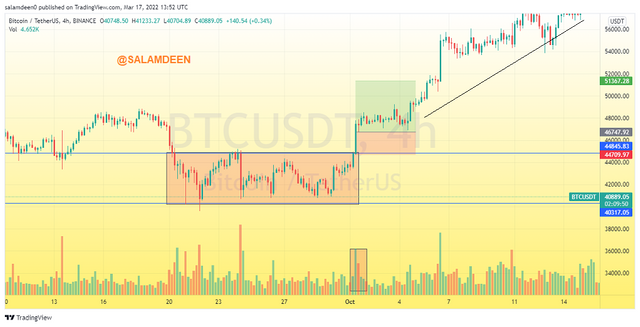
From the chart above, it can be seen that there was accumulation within September last year and the price rallied in the subsequent months. A re-accumulation occurred along the line and the price can be seen to break above the re-accumulation level upwards.
Distribution phase
The distribution phase is contrary to the accumulation phase. It comes after the accumulation phase. At the distribution phase, the trend slows down from an uptrend to a sideways trend. This is the phase where the strong hands give out the accumulated assets to take some profits. At this point, the strong hands create sell walls to create fear, uncertainty, and doubt (FUD) in the market.
They do this by setting up large sell orders to drive the price lower because of the higher volume of their orders. Due to the FUD in the market, this will attract the attention of the weak hands to start selling, and they will react by selling at low prices to quickly exit their position.
This will form a sideways trend. The high volume of sell orders will increase the supply of the asset, and more selling will drive the price lower to break the sideways trend downwards.
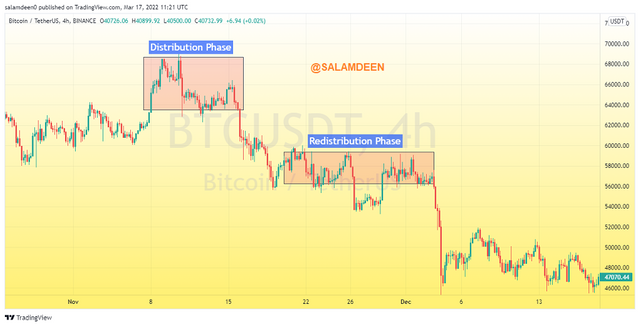
Screenshot from tradingview.com
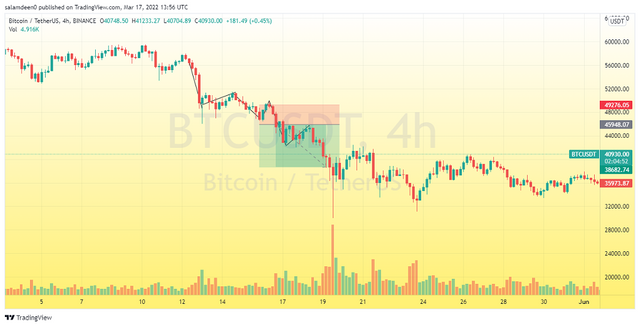
The chart above shows the distribution and redistribution phases in the 4 hour timeframe chart of BTC/USDT.
Explain the 3 phases of the market and how they can be identified on the chart.
When it comes to trends, there are three main phases in the market. We have the bullish phase, the bearish phase, and the sideways phase, and they are explained below:
The bullish phase
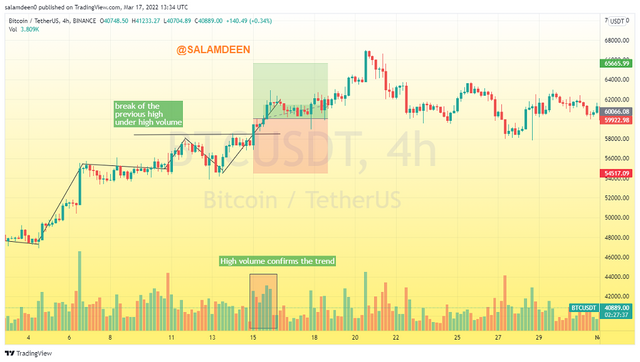
This is the phase where traders are generally optimistic about the market. At this phase, the market accelerates over a period of time. Many effects contribute to the bullish trend, which is driven by more buying in the market. The bullish phase always starts after the accumulation phase breaks upwards. That is when the price will start rising, and on the chart, you will see the formation of higher highs and lower lower highs. We can use the formation of new highs and the domination of strong bullish candles to confirm an uptrend.
Consider the chart below. It can be seen that, as the price broke above the accumulation zone, the market was rising upwards with higher highs and lower lows and strong bullish candles.
Screenshot from tradingview.com
Bearish Phase
The bearish phase is directly opposite to the bullish phase. Here, the market participants are more pessimistic about the market, and it is characterized by more selling than buying. This is when most traders get rid of the asset by selling it out. The demand will reduce drastically, but the supply will increase as the price declines and the selling volume will overcome the buying.
The bearish phase starts after distribution when the strong hands sell off some of their holdings. At this point, the chart will be forming higher lows and lower lows, and bearish candles will be dominating the market.
Consider the chart below: It can be seen that, the price declined drastically after the distribution phase with the formation of higher lows and lower lows.
Screenshot from tradingview.com
Sideways Phase
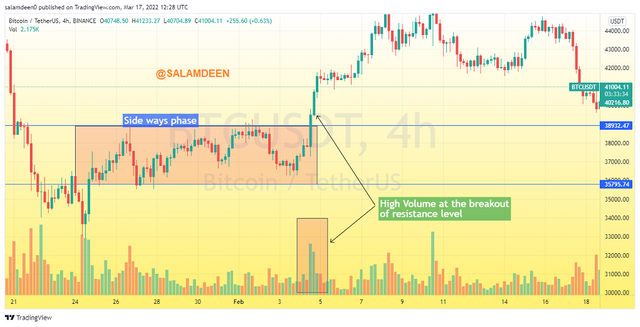
This is the phase of the market where there is no clear trend, as it will be trending in ranges. In a sideways market, the trend will be consolidating between two close support and resistance levels. The breaking of these levels determines the next trend of the market. There are usually high volumes at these levels; it could be an accumulation or a distribution area. When it is a distribution area, the market is expected to reverse its downtrend when it breaks the major support level. In contrast, if it is an accumulation phase, the trend is expected to reverse to a bullish trend after the break of the resistance level. It is always necessary to pay attention to the breakout of the support and resistance levels in a sideways phase as it will determine the possible move of the market.
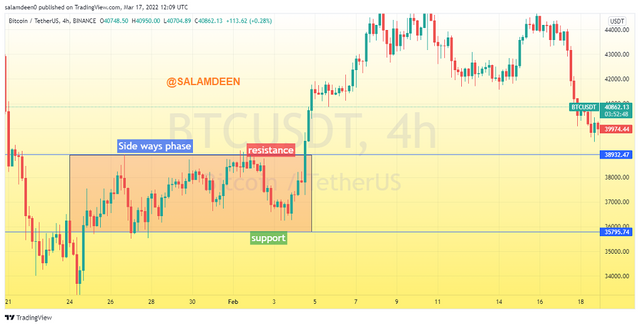
Screenshot from tradingview.com
In the BTC/USDT 4 hour timeframe chart above, the market was in a sideways phase until it broke above the resistance level to form an uptrend.
Explain the importance of the volume indicator. How does volume confirm a trend? Do this for the 3 phases of the market (screenshots required).
The volume indicator plays a very important role when trading with price actions as it gives information about the current state of the market and the possible move. When the volume is high, it means there are currently larger transactions in the market. The market will always react after a period of higher trading volumes. We can compare the current state of the volume indicator to the market phase to determine a possible move of the market or to confirm the trend.
Some of the ways to confirm a trend in the three phases of the market are illustrated below:
Side Ways Market:
If the market is going sideways, we can monitor the actions of the volume indicator to understand the current state of the trend. When there is a breakout of a support or resistance level in a sideways market, the volume indicator can be used to confirm the trend. If there is high volume at the breakout level, it indicates that the trend is likely to keep the breakout. Consider the chart below. It can be seen that there was a breakout of the resistance level and the volume indicator showed high volume at the breakout. This confirms the trend, and the trend really continued towards the breakout trend.
Screenshot from tradingview.com
Trending Phase (Bullish and Bearish Phase)
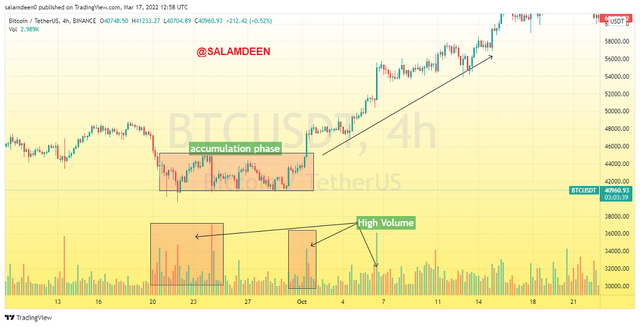
Market trends mostly start and end with higher trading volumes. Hence, we can identify the end and the beginning of a trend with the volume indicator. The accumulation and distribution phases start and end with high trading volume. When a market is in a clear trend, the volume is usually lower. If you realize a significant rise in volume in a trend, it indicates the beginning of a new phase in the market.
Consider the chart below. It can be seen that, the trend was initially a downtrend and the volume indicator showed a rise in volume before the beginning of the accumulation phase. At the breakout of the accumulation, there was also a rise in volume, which confirmed the breakout.
Screenshot from tradingview.com
Explain the trade criteria for the three phases of the market. (show screenshots)
We first confirm the trend by checking for the formation of higher highs and lower highs. If this is confirmed, we then wait for the price to bounce back from a high point to form a low point. As the price starts to retrace from the low point, we then monitor for the price to break above the next high. We can consider setting our entry when the volume indicator shows high volume and the formation of a strong bullish candle above. With proper risk management, the stop loss should be set at the previous low, and we can set our take profit.
Consider the chart below: There was a clear uptrend as the trend was forming higher highs and lower highs. I set up an entry position after the breakout of a high point and the volume indicator showed high volume. My stop loss was set at the previous low, and my take profit had a risk-reward ratio of one to one.
Screenshot from tradingview.com
In a bearish trend, we first confirm the trend. A chart is in a bearish trend if we observe the formation of higher lows and lower lows. To get a suitable entry, for a sell trade, we wait for the price to retrace to a new high point. As the price bounces back from the high point, the entry can be set after the breakout of the previous low. The entry should be set only when there is the formation of a strong bearish candle with an indication of high volume from the volume indicator. The stop loss should be set near the previous high and the take profit can be set with a suitable risk reward ratio.
In the BTC/USDT 4-hours timeframe chart below, my entry into the bearish trend was set as the price broke the previous low. The stop loss was set at the previous high with a risk reward ratio of 1:2.
Screenshot from tradingview.com
Trading Criteria for a Sideways Trend
A sideways trend could result in an uptrend or a downtrend because there could be a breakout upwards or downwards. In a sideways market, we first of all identify the major support and resistance levels. The breakout of any of these levels will determine the next move. There are usually false breakouts at these levels, so it is necessary to confirm them well before taking a position. If there is a breakout of the resistance level under high volume and the formation of bullish candles, we can consider setting a buy trade with proper risk management. We can set a sell trade if there is a breakout of the support level and the volume indicator confirms high trading volume.
In the chart below, the chart was in an entry. I set up an entry after the breakout of the resistance level with a risk reward ratio of 1:2.
Screenshot from tradingview.com
With the trade criteria discussed in the previous question, open a demo trade for both buy and sell positions.
Here, I opened buy position for the RUNE/USDT pair on tradingview.com. In the first place, I identified the trend to be an uptrend. The chart was forming higher highs and lower highs. I opened a buy position when the price retraced from a low point to break the previous high point with significant trading volume. I set my entry at the breakout with my stop loss at the previous low and the take profit was set with 1:2risk reward ratio.
The Chart
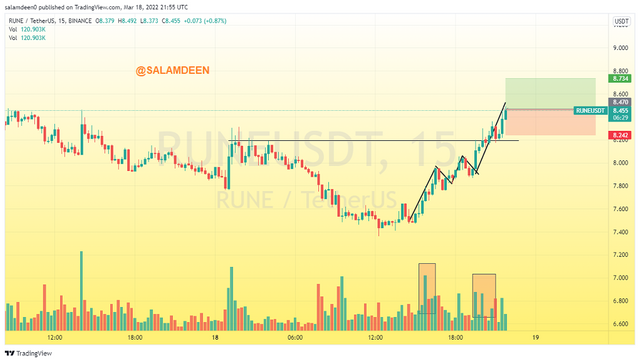
Screenshot from tradingview.com
Buy position setup
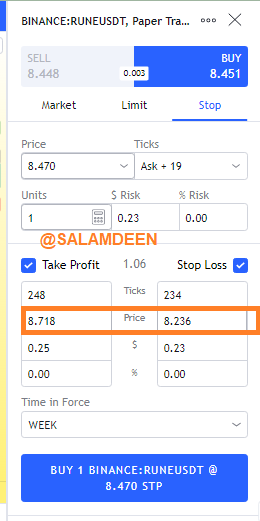
Screenshot from tradingview.com
The filled order
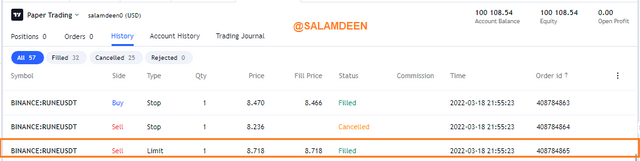
Screenshot from tradingview.com
Conclusion
Price is always driven by market psychology. That is why it is necessary to know the activities of the big players in the market. They are institutional investors and they have a very great impact on the market. Trading based on the market psychology will make a retail trader think like an institutional investor, with this, you will not fall a victim of their activities on the market.
I have learnt that, we must first of all identify the market trend before taking a position. The market could be in a downtrend, uptrend or sideways trend. A sideways could be an accumulation phase or a distribution phase, if it is at the distribution phase, it shows that, the big players are currently accumulating funds which signals a bullish trend. In contrary, if the market is in distribution, it indicates that, the big players are exiting their positions for profit. Breakout of any of these phases give a clear signal of either a downtrend or an uptrend.
This lecture was very useful to me and most of the other participants, I have learnt a lot about activities that occurs in the market between the strong hands and the weak hands. I want to thank professor @reminiscence01 for this lecture.
Hi respected @steemcurator01 and @steemcurator02, I want to use this medium to make a request for a powerdown of 274 worth of my SP (26%) for a critical solution. I know my club status will be affected and I'm very sorry for this. I'll cover it up in due time. Thank you🙏