Crypto Trading by Identifying Support and Resistance - Steemit Crypto Academy | S6W3 | Homework Post for professor@shemul21
Hello, crypto enthusiasts. This is my presentation of the homework task by professor @shemul21!

Cover

1. What is the Support & Resistance zone?
Support and resistance are very important zones on the chart, they reflects points where the demands and supply meet. The support and resistance zone plays a very important role in determining the market psychology of the market participants. These levels are usually difficult to break and if the price is able to break through them, it is expected to be followed by either higher demand or supply. Support and resistance zones can be spotted in all chart patterns, like consolidating or trending charts.
A support zone represents a level on a chart with strong demand as there is more buying than selling at these zones, and the price mostly reverses upwards when it hits the support zone. It hosts most of the buy orders. However, if the price is able to break through this level, it means the supply has overcome the demand and the price is expected to fall further.
The resistance zone, on the other hand, represents levels on the chart with strong supply. This level hosts a lot of sell orders. Hence, there is more selling at the resistance level, so the price is likely to retrace when it hits the resistance zone. However, if the price is able to cross this zone under high volume, the price is expected to rise further as this is an indication that there was strong buying enough to break the level.
The support and resistance mechanisms work based on the psychology of the buyers and sellers. They generally consider these zones to be difficult to break into, and the entry and exit positions are placed at these levels. For instance, if the price is able to break a support level, it will now become a resistance level and traders who enter short positions will set their stop loss at the resistance and take profit at the next support level, and vice versa if the price breaks a resistance level. If you are able to correctly identify the support and resistance zones on the chart, there is a higher probability that the price will act as expected as this is the general psychology of the buyers and sellers.
Explain different types of support and resistance with proper demonstration.
According to the lecture by professor @shemul21, support and resistance zones are usually in three forms. Below are the three types of support and resistance zones.
- Horizontal Support and Resistance
- Slopping support and resistance
- Dynamic support and resistance
✔✔Horizontal Support and Resistance
Horizontal support and resistance, as the name implies, are identified by drawing a horizontal line across multiple highs or lows. These are points where the price usually bounces back. Horizontal support and resistance levels can easily be identified by a horizontal line. In some cases, they represent points with round numbers like, 1, 1.5, 2, 10, and 1.25. These are the points with most buy and sell orders. For instance, in the STEEM/USDT higher timeframe chart, there is some support and resistance at $0.3, 0.35, 0.4, 0.7, etc., which can easily be identified by ruling a horizontal line at these points. Horizontal support and resistance zones switch their roles.
This means that, a broken support level will be switched to a resistance level and this applies equally to a broken resistance level as it also turns to a support level. The horizontal support and resistance levels weaken as the price breaks them. The horizontal support and resistance levels are more accurate on higher timeframes than on lower timeframes.
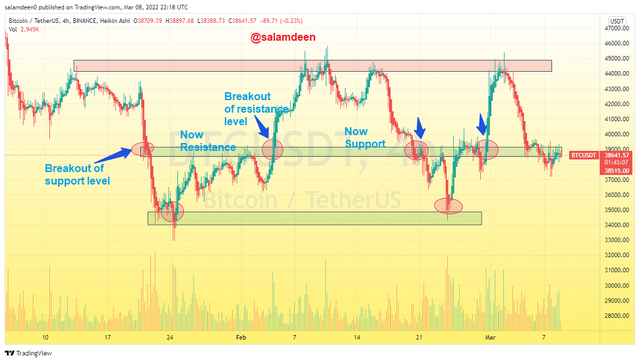
Screenshot from tradingview.com
As seen in the BTC/USDT chart above, I have identified horizontal support and resistance levels. As I indicated earlier, the horizontal support and resistance zones switch roles. At some points in the chart above, where a support level breaks, it forms a resistance level . BTC is currently lying at a support level in the 4 hour timeframe chart.
✔✔Slopping support and resistance
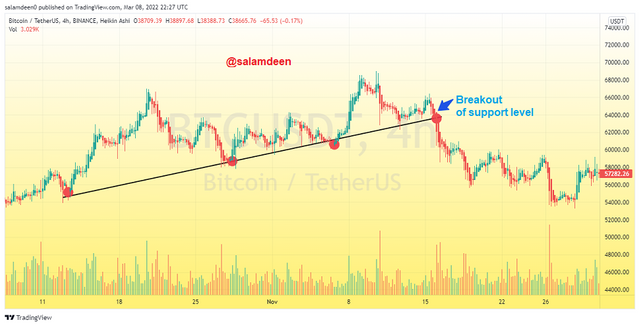
They can also be regarded as trendline support and resistance levels as they are formed at trendlines and channels on the chart. During a downtrend, higher lows are formed as resistance levels, we can make a trend line to represent the resistance level and the resistance level formed is regarded as downtrend resistance, the price have higher probability of bouncing back from here and if this level is broken with higher trading volume, the price is likely to follow the breakout.

Screenshot from tradingview.com
In the BTC/USDT chart above, the trend is in a downtrend and the lower highs are acting as support zones. The price bounces back after touching these levels. The breakout of the trendline support resulted in the price declining further and the support levels have now turned into resistance. This indicates that, in slopping support and resistance, they switch roles. A broken support will turn to resistance and vice versa.
On the other hand, in an uptrend, lower highs are formed. We can draw a slopping line to represent the support level formed. The lower highs form a support level, which can be regarded as an uptrend support level. When the price falls to this level, there is a high chance that it will bounce back. A breakout of the uptrend support level is likely to be a downtrend. The sloping support and resistance levels are more accurate in an uptrend.
Screenshot from tradingview.com
As seen in the BTC/USDT chart above, which is an uptrend. The lower lows serve as support zones, and the price retraces at these levels.
✔✔ Dynamic Support and Resistance Zones
This type of support and resistance zones is similar to the slopping support and resistance levels. They change as new price ticks are formed, as the price will try to withstand the change and attempt to retrace. They are normally identified with the use of moving averages. We can use any of the types of moving averages to identify dynamic support and resistance levels, the most commonly used are the EMA-20, EMA-50 and EMA-200. When the price touches any of these levels, it is likely to bounce back, and their breakout is also likely to form a clear trend, especially the EMA-200. The moving averages will act as support in an uptrend and resistance in an uptrend.
🏴Dynamic Support Zone
As seen in the screenshot below, the price is in an uptrend and the moving averages are acting as dynamic support zones. The price touches the EMA-20 and EMA-50 and retraces back, which indicates the price is in a healthy trend. As the price touched the EMA-200, the trend was reversed to a downtrend
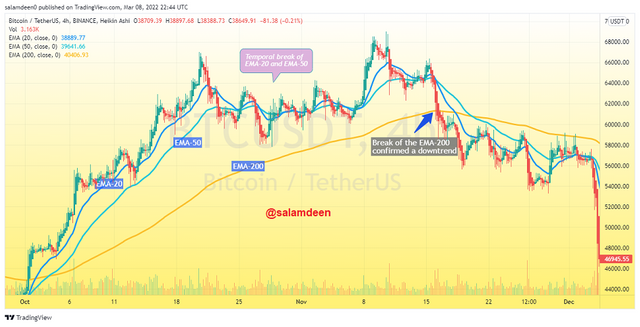
Screenshot from tradingview.com
🏴Dynamic Resistance Zone
In the chart below, the moving averages are serving as resistance levels. The price is in a clear downtrend and bounces back from the moving averages. The breakout of the EMA-200 will be a bullish signal.
Screenshot from tradingview.com
Identify The False & Successful Breakouts. (demonstrate with screenshots)
Whenever a price breaks a support or resistance zone, the trend is expected to follow the trend of the breakout. For instance, when the price is consolidating and then manages to break a resistance level, it is expected to continue in an uptrend. However, it is not guaranteed that the trend will always follow the breakout. That is why we have false and successful breakouts. A breakout could tend to be a false one, and traders who panic to create their positions will be at a loss. That is why it is always good to confirm a trend with other factors before taking a position in order not to be lured by a false breakout.
🏴Identifying a Successful Breakout
When a successful breakout is formed, we expect the price to continue the trend of the breakout. For instance, if a price breaks the resistance level, it indicates that, the action of buyers was able to surpass that of the buyers, and if the trading volume is high enough at this time, it will follow the trend of the breakout. That is why it is always required to confirm a breakout with a volume indicator. A breakout could be a continuation of a trend or a reversal. In all cases, higher volume will be required to sustain the breakout. In most cases, a trend could retrace back to the level of breakout before reversing back to the trend.
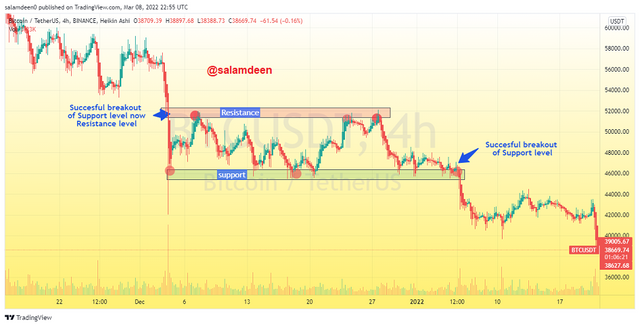
Screenshot from tradingview.com
In the chart above, the price successfully broke a support level, and it has now turned to a resistance level. As the price was ranging between the support and resistance levels, there was a successful breakout of the support level and the trend followed the breakout. This means that there was higher selling volume during the period of the breakout.
🏴Identifying a False Breakout
False breakouts are formed due to so many factors. The most common factors are lower trading volume and market sentiment. That is why it is always good to confirm a breakout with the formation of strong candles at higher trading volumes before taking your position. Other indicators like momentum or volume indicators can also be added to filter the signal.
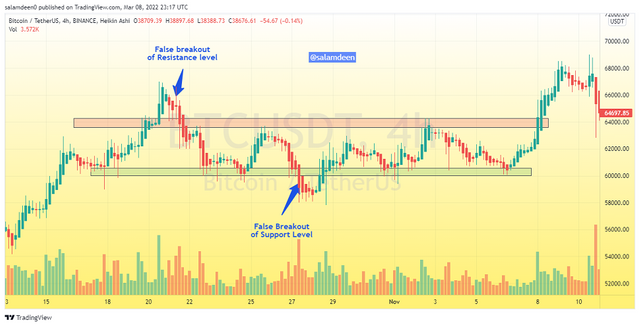
Screenshot from tradingview.com
I have identified a false breakout in the screenshot above. It can be seen that the price couldn't follow the breakout but rather reversed back to the support and resistance levels.
Use Volume and the RSI Indicator Combined with Breakouts & Identify the Entry Point. (demonstrate with screenshots).
As seen in the chart below, the price temporarily broke a resistance level and it is now serving as the support. As the price retraces from the breakout and the breakout to the support level, I confirmed with the volume indicator that, there was higher selling volume than buying and the RSI oscillator declined below the 5 marks to confirm the support level breakout. I then set my entry and the exit, both set with a 1:2 risk reward ratio.
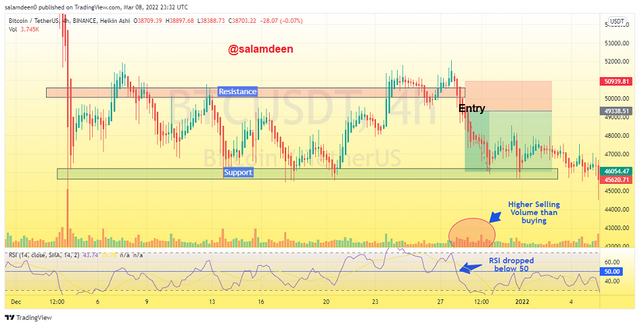
Screenshot from tradingview.com
Take a Real Trade(crypto pair) on Your Account After a Successful Breakout. (transaction screenshot required)
After verifying a signal from the breakout of the resistance level, I executed a real trade with the SCRT/USDT pair in my exchange account. I confirmed the breakout with the volume, and there was higher buying volume and the RSI was above 50. When the RSI crosses 50, it confirms the breakout of the resistance level.
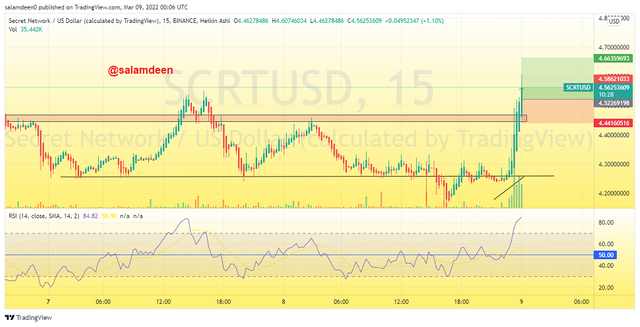
Screenshot from tradingview.com
✔✔The buy trade
 |  |
Explain the Limitations of Support & Resistance (false breakout).
Support and resistance levels play a very important role as they help traders identify levels with strong demand and supply. The breakout of these levels gives a signal of the possible direction of the trend. However, in most cases, the breakout of these levels usually turns out to be false.
Traders who are lured by the false breakout will end up losing their money. False breakouts occur because the crypto market is highly volatile. Lower trading volumes and market sentiment led to the formation of false breakouts breakout resistance or a support level is broken, it will require higher volumes to keep the breakout Or else, lower volumes are likely to form exhausted candles and the breakout will not be sustained.
To reduce the risk, you should always place a stop loss a few pips closer to the support or resistance zone so that if there is a false breakout, you will not be greatly affected. It is also necessary to increase the strength of your strategy with other technical indicators.
Conclusions
Support and resistance zones are very important foundations when it comes to technical analysis. Identifying the key support and resistance levels with multiple timeframes will always increase your win rate. Support and resistance zones help traders set entry and exit positions. Because they are widely used by both traders and investors, they usually give the expected signals. Support levels can be used along with any of the indicators to increase the strength of our signal so that false breakouts can be easily figured out.
The lecture was very helpful as I have learnt a lot with regards to trading with support and resistance levels. I will stop here by thanking professor @shemul21 for this important lecture. I ca take part in the subsequent lectures.