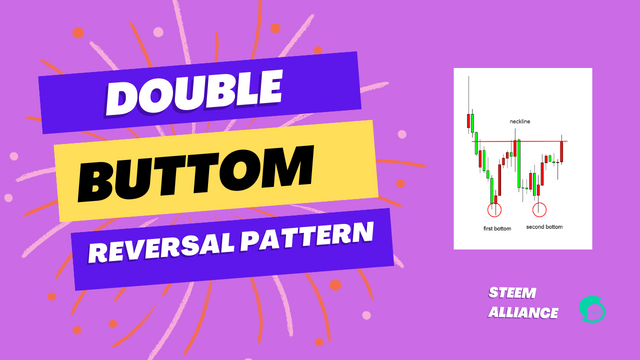
Double Buttom Reversal Pattern || Steem Alliance
The Double Bottom Reversal Pattern is a common technical analysis chart pattern that signals a potential reversal in the trend of an asset. It is formed when the price of an asset hits a bottom twice in a similar manner, creating two troughs at approximately the same level. The pattern is usually seen after a prolonged downward trend and can be used by traders as a signal to buy the asset.
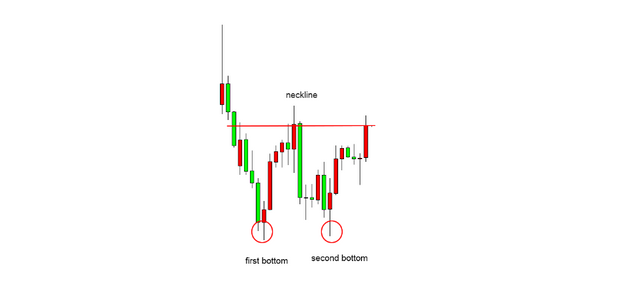
The Double Bottom Reversal Pattern is created when the price of an asset hits a bottom twice in a similar manner, creating two troughs at approximately the same level. The first bottom is typically the result of a decline in the asset's value, and the second bottom is typically the result of a failed attempt to push the price lower. This pattern is considered a bullish reversal signal as it suggests that the downward momentum has ended and that the asset is likely to start a new uptrend.
The pattern is considered to be complete when the price of the asset moves above the highest high between the two bottoms, which is known as the neckline. The height of the pattern, which is the distance between the bottom and the neckline, can be used to calculate the potential upside of the asset.
The Double Bottom Reversal Pattern is considered to be a reliable reversal signal as it suggests that the trend of the asset is changing direction. However, it is important to note that the pattern is not a guarantee of a reversal and that other factors such as volume and momentum should also be considered before making a trade. Additionally, the pattern can be used in conjunction with other technical analysis tools, such as trend lines and moving averages, to provide a more comprehensive view of the market.
In conclusion, the Double Bottom Reversal Pattern is a commonly used technical analysis chart pattern that signals a potential reversal in the trend of an asset. It is formed when the price of an asset hits a bottom twice in a similar manner, creating two troughs at approximately the same level. The pattern is considered a bullish reversal signal and can be used by traders as a signal to buy the asset. However, it is important to consider other factors such as volume and momentum before making a trade, and to use the pattern in conjunction with other technical analysis tools for a more comprehensive view of the market.
VOTE @bangla.witness as witness

OR
Thanks.


Thank you, friend!


I'm @steem.history, who is steem witness.
Thank you for witnessvoting for me.
please click it!
(Go to https://steemit.com/~witnesses and type fbslo at the bottom of the page)
The weight is reduced because of the lack of Voting Power. If you vote for me as a witness, you can get my little vote.