TRADING WITH ACCUMULATION/DISTRIBUTION A/D INDICATOR/ CRYPTO ACADEMY S4W5, HOME-WORK POST FOR@ALLBERT

EXPLAIN IN YOUR OWN WORDS WHAT THE A/D INDICATOR IS AND HOW AND WHY IT RELATES TO VOLUME. (SCREENSHOTS NEEDED).
The A/D Indicator can be defined as a volume based Indicator, that is basically used to detect various trends of stocks, this Indicator has a relationship with price and volume flow, accumulation is more like buyers been in demand, and Distribution donates sellers (supply), so this two works in opposite to each other, if there are pressure exerted on supply and demand one can easily predict the trends.
A/D Indicator measures the relationship between divergence, various prices of stocks and volume flow, by this gesture it gives a clear overview of buying and selling pressure of stocks, we know that in most cases using an indicator to confirm trends doesn't really go in one direction, price might be going up while Indicator is pointing toward another direction, that is called divergence.
IMPORTANT TAKE AWAY POINTS
A/D Indicator can be used in full momentum to access the speed of a Volume in respect to price movement, it can also detect when to buy and sell.
addition and subtractions are usually done in the period value from the last, thereby making A/D line cumulative,
Whenever there is an uprise in A/D, line is a sigh of a potential Uptrend, vice versa.
WHY IT RELATES TO VOLUME
A/D, line has a good responsibility as it helps to detect supply and demand, the lines moves in opposite direction, sometimes in the same direction it depends on how price reacts. The calculations are been centralized on on the movement occured in the market Courtesy buying and selling, by this you can easily detect where price will close, triggered by the volume.
Now let's say stock makes a twist and closes closer to the high of the period, and it's volume is pretty high, it will signal an uptrend move. Let's say at the high of the range stock closes, volume won't experience an uprise instead volume will be low, so is a kind of a vice versa.
THROUGH SOME PLATFORMS, SHOW THE PROCESS OF HOW TO PLACE THE A/D INDICATOR (SCREENSHOTS NEEDED).
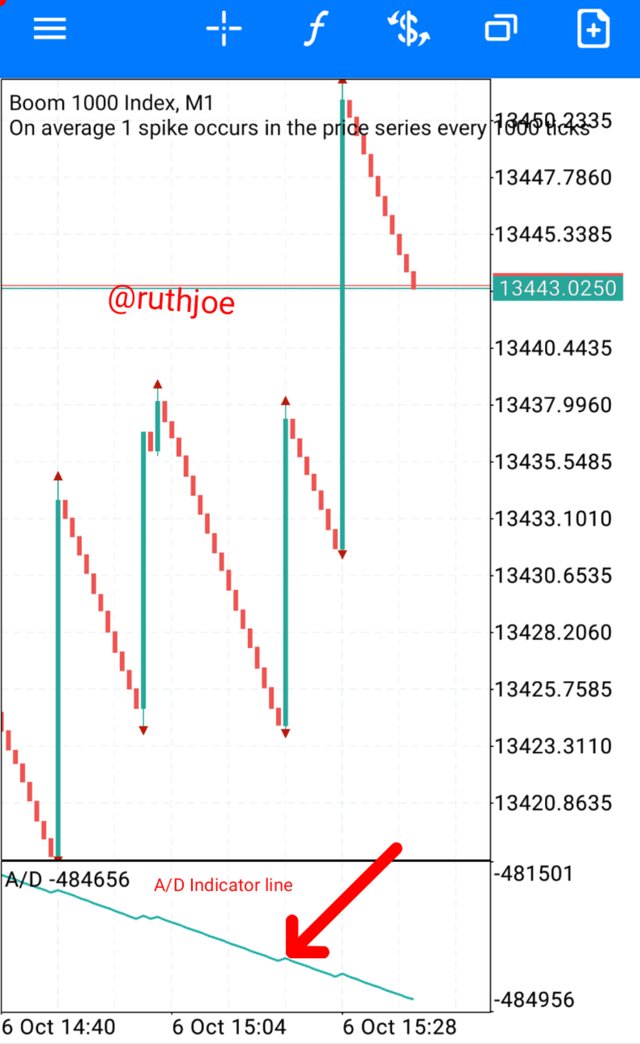
Courtesy this question I will be using my MT5 Demo account to give a clear illustration, we should understand that this is an indicator that relates to price and volume flow,
- Placing an A/D Indicator is very simple all you need to do is to click on the Indicator sign on the edge, this sigh f.
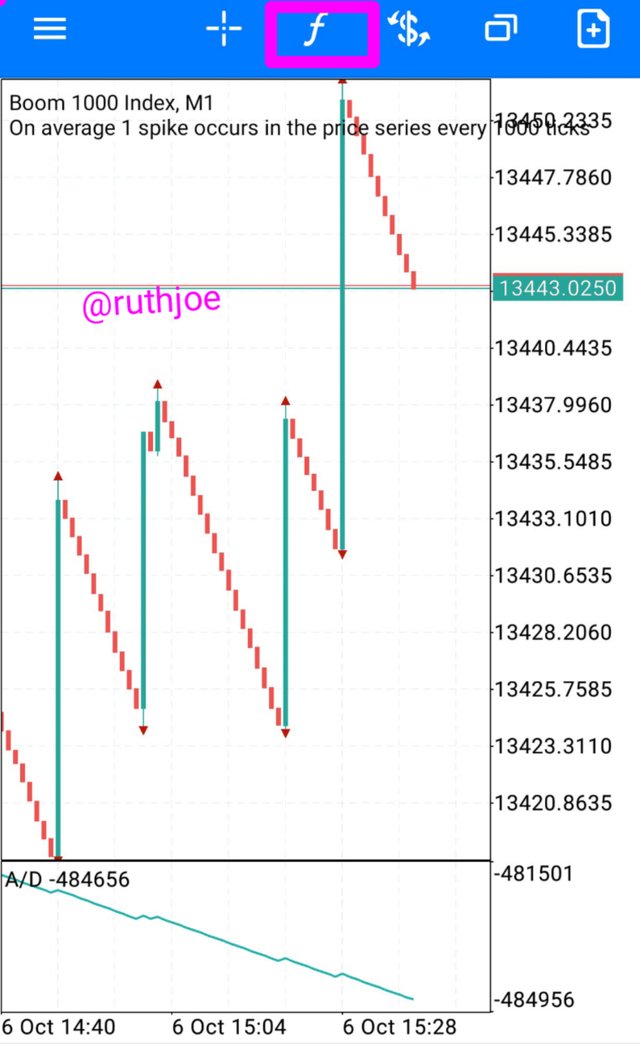
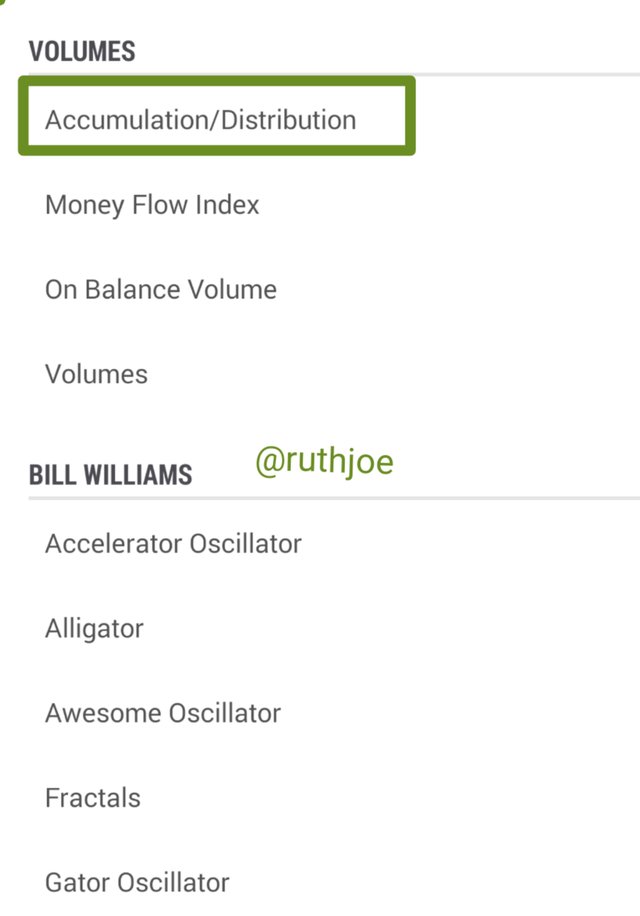
After you are done clicking on the Indicator sign you proceed, another phase will pop up where you will then have to add it to your chart.
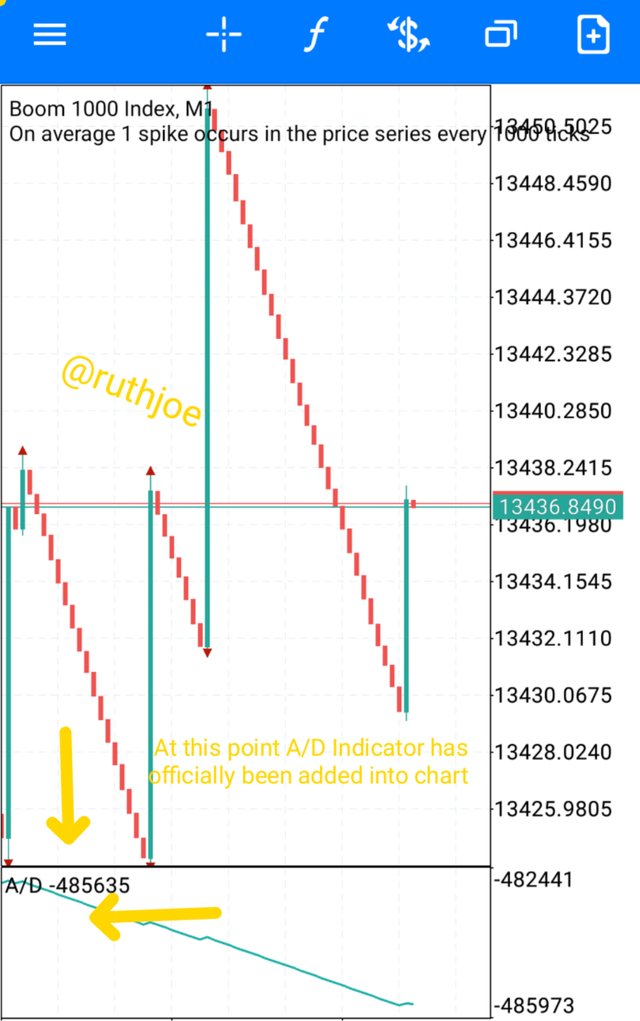
After that is been done you can decide to do little writting, thereby changing the colour of the A/D, lines and all the rest.
At this point your A/D Indicator has officially been placed on a chart, now looking on the chart very well you will understand that the Indicator moves as price movement does.
So you can easily use this Indicator to confirm price movement in the market.
EXPLAIN THROUGH AN EXAMPLE THE FORMULA OF THE A/D INDICATOR. (ORIGINALITY WILL BE TAKEN INTO ACCOUNT).
I will say most Indicators have specific way at which they are usually calculated and the A/D, Indicator isn't an exception here.
This is practically the formula used to calculating it, later it will be broken down.for clearer understanding.
MFM=CLOSE-LOW(c-l)-HIGH/HIGH-LOW(h-l)
Breaking this down we have
MFM= simply means money flow multiplier.
Close= the closing price.
Low= low price courtesy the period/for the period.
High=high price courtesy the period/for the period.
LET ME SHOW HOW A/D LINES ARE BASICALLY CALCULATED FOR CLEAR UNDERSTANDING.
Talking about A/D, line calculation, first we start by calculating the multiplier, the rescent period is seen as the close remember, so we basically use the high and low to calculate.
The multiplier will be taken into consideration while calculating the period Volume it might be the current one, or even the money flow volume.
You will have to sum the money flow value, in conjunction to the A/D, value this is for the bigining calculation, Money flow value is always the first to be used.
Whenever each period ends you Carry out your addition and subtraction. In order to detect your money flow.
HOW IS IT POSSIBLE TO DETECT AND CONFIRM A TREND THROUGH THE A/D INDICATOR? (SCREENSHOTS NEEDED)
Just as we know indicators are basically applied on a chart with the sole motive of price confirmations, the market in general is a very volatile one so you need not just one but multiple Indicators for price confirmations.
Now for me I think the best way to confirm trend is by drawing your trend-line from the Support level where the last retest started let's view the screenshots below.
Now looking at the chart below you will find out that I drew a trend-line from the Support level upwards, before drawing the trend-lines price was in an uptrend, because the rescent high, is greather than the previous highs.
Price went up retested, went up again retested, it happened in various ocassion's before going bearish, from the look of things price will still go bearish until it's able to break the previous Support level and thus form another structure.
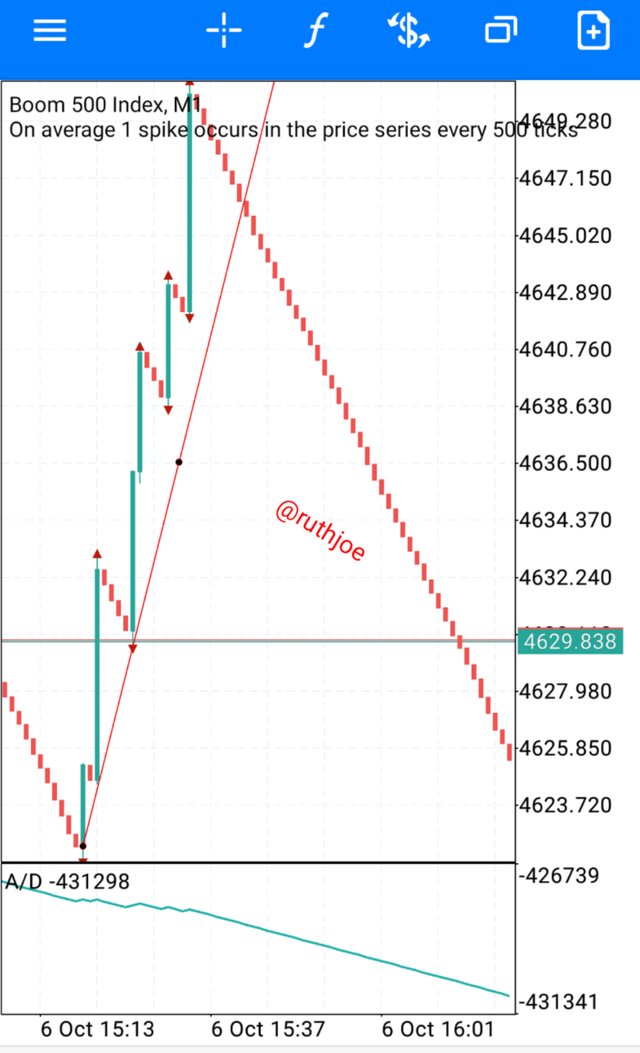
Confirming the validity of a trend has to do with the process by which price hit the trend-lines multiple times, this has happened from the chart, in my opinion trends have been confirmed.
I will only enter this Market, when I see that price has broken the previous Support level, to form a new structure, then I will then draw another trend-line, and I will also get confirmation from A/D Indicator before I proceed further.
THROUGH A DEMO ACCOUNT, PERFORM ONE TRADING OPERATION (BUY or SELL) USING THE A/D INDICATOR ONLY. (SCREENSHOTS NEEDED).
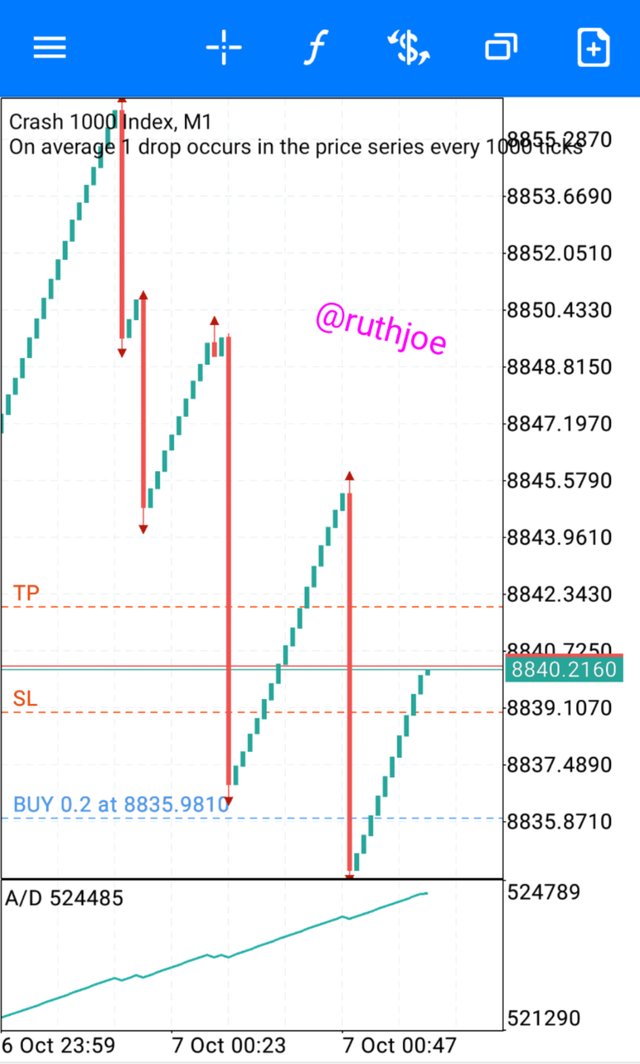
Here I'm using my MT5 Demo account to perform this task, I have already added the /D Indicator to chart so I bought crash 1000, very important I indicated my stop loss region and my take profit region as you can see vividly from the chart. Boom 1000 is currently on a downtrend at the time of writting this post reason been that price has formed series of higher lows practically in various ocassion's.
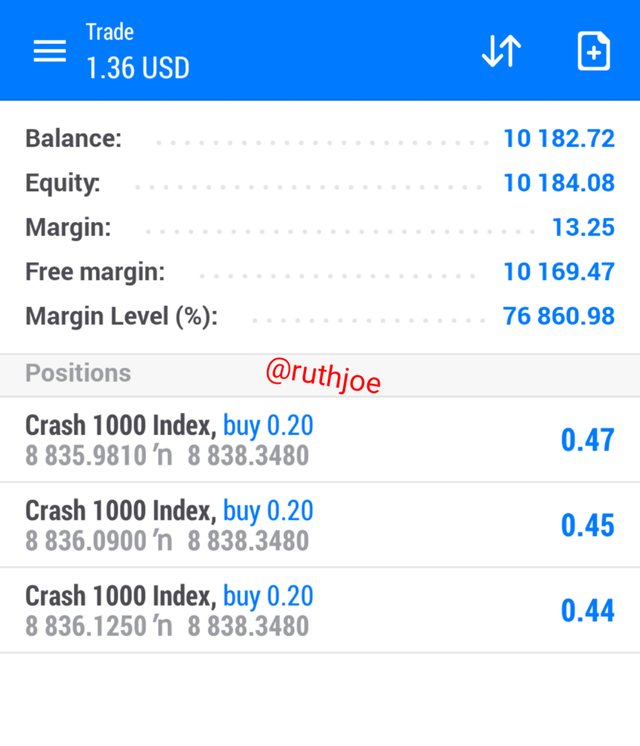
I used 0.20 lots size with proper risk management system, although my Equity is very much good to carry the lots size. After price got to a point I have to close some positions and collect my profits that's practically the simplest way to trade MT5.
WHAT OTHER INDICATOR CAN BE USED IN CONJUNCTION WITH THE A/D INDICATOR. JUSTIFY, EXPLAIN AND TEST. (SCREENSHOTS NEEDED).
For price confirmations I prefer using multiple Indicators, let's say I'm using three Indicators, for me to confirm any form of entry the various Indicators in use must give me confirmations.
Indicator moves as price moves, but most times divergence occurs, whereby Indicator will thus move in opposite direction with price, another important factor here is trading with structure price respects structures alot that is why drawing trend-lines are very. Important.
Answering the question been asked vividly I think I will be using the MACD, and the parabolic SAR. From the chart uploaded I drew a trend-line from the peak that was forming series of Higher highs, you will understand the trend is valid because price has tested it many times without breaking it to form new trends.
I bought boom 500 and my Take profit and my stop loss was indicated, after my Analysis I discovered that price will move downtrend for a while MACD Indicator has showned it, price is planning to break the strong support level in order to form another structure, downwards.
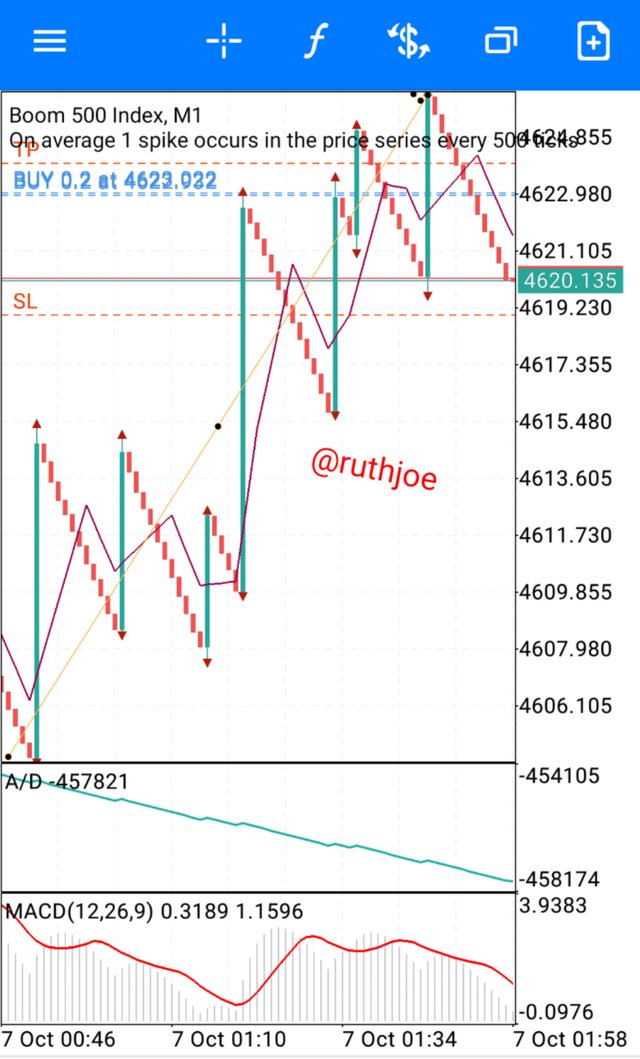
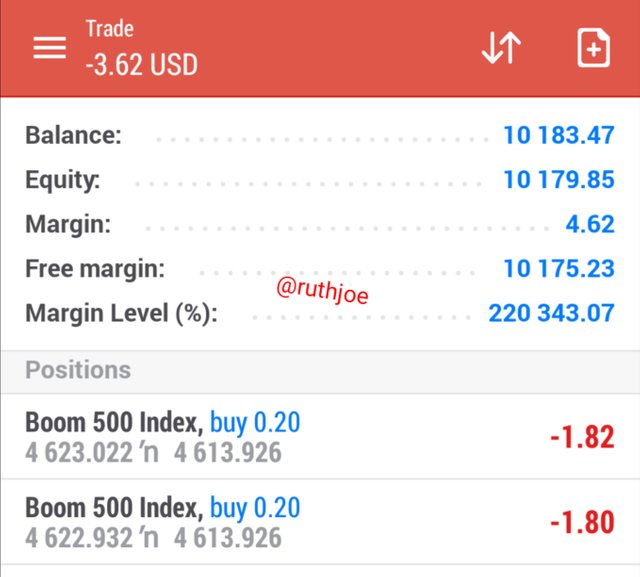
This are the market I bought boom 500 to be precise, they haven't yet yielded profits because Market haven't spiked yet, but already my stop loss and take profit zone has already been indicated, hopefully I was able to place a trade.
CONCLUSION
From my homework task, I was able to explain that A/D Indicator is a Volume based Indicator that is used to figure out trends of various stocks in the market. With the use of this Indicator you can easily know whether price is accumulated or distributed, I also pointed out that AD, line helps in figuring out divergence, this is a period where A,D, Indicator line moves in opposite direction with price. I also hinted on A/D, relationship with volume, where I said that it assists in determining demands and supplies.
Professor @allbert note all charts used are all mine collected from my MT5 trading platform, no chart was collected from a copyright free source, many thanks to your good lectures, trust me I really learnt alot thank you very much professor.