CRYPTO TRADING WITH SUPERTREND INDICATOR/ STEEMIT CRYPTO ACADEMY S5W7/ HOME-WORK POST FOR @KOUBA01
INTRODUCTION

Trading today is a global brand one can easily explore the market with he's/her strategy all with the motive of maximizing Profit potential's, trading is very volatile as the market are basically dominated by buyers and sellers, they both push the market to different phases, her market structure comes to fruition.
In the world today, many traders still find it very difficult to knowing when to buy or sell stocks in the market, here in this home-work all this questions will surely be addressed, till today so many traders still ask which Indicator is the best for trading.
One basic thing I know is that technical analyst detect trends as a result of various parameters not just with multiple Indicators, or with the use of Indicators, at this point we shall talk about a powerful trading tool/Indicator called the supertrend Indicator.
Show your understanding of the SuperTrend as a trading indicator and how it is calculated?
Before we talk more on how this wonderful Indicator is been Calculated let's hint extensively on supertrend Indicator, this Indicator looks like moving average Indicator, when this Indicator is plotted one can easily determine current trend of an assets.
This Indicator construction is pretty cool as it has two basic parameters namely period and multiplier, in constructing this Indicator we make use of the default parameter are basically 10 ATR, and three are seen as multiplier, remember the ATR plays a vital role courtesy the supertrend oscillator.
Formular for Calculation
You will agree with me that every Indicator has its formular/model of Calculation, and supertrend Indicator can't be an exception here, how it's been Calculated is basically illustrated below. I will show how up and down are been Calculated.
Up phase=[(high+Low/2+ATR])
Down phase=[(high+Low/2-ATR)]
NOTE in both up and down phase Calculations since supertrend Indicator deals with two basic parameters which are periods and multiplier, we can add the multiplier.
We can't talk about supertrend Indicator without hinting on how ATR Aid been Calculated, remember in contracting this Indicator ATR is key, let's hint on the Calculations.
- [(ATRX13])+rescent TR]/14
Note 14 shows a period length, it is usually configured while editing the Indicator, to get the ATR you have to multiply by 13. ATR role courtesy supertrend Indicator is top-notch that is why I hinted on the Calculations.
What are the main parameters of the Supertrend indicator and How to configure them and is it advisable to change its default settings? (Screenshot required)
Every Indicator has parameters, it's practically optional to you as a trader to change various parameters outlined, courtesy this Indicator it has three various parameters which are the input, style, and visibility.
They are the three various parameters here I will show how they are been configured, I will configure it to suite my trading style, watch and see how it onfolds.
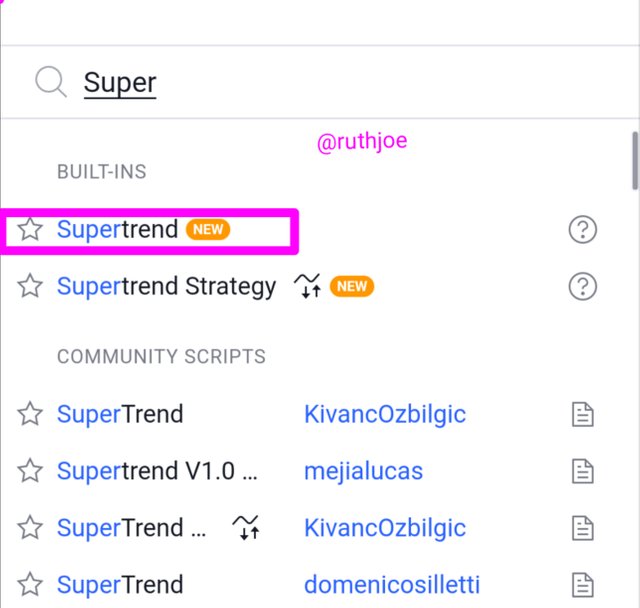
- At first access your trading view App I already have an account with then, I clicked at the search axis and searched for supertrend Indicator it came up and it was added.
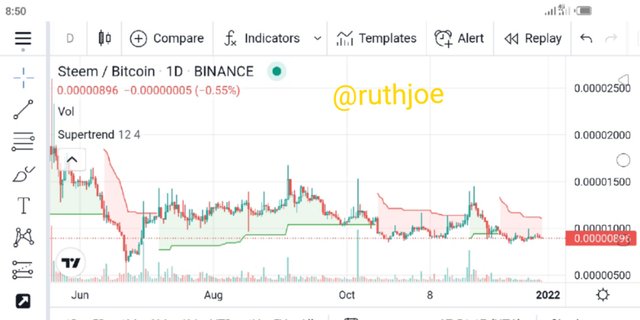
After that at the landing home-page the Indicator appeared on my chart pair, I previousl selected STEEM/BTC as my pair.
Another phase came up this time I will configure the various parameters instituted courtesy this Indicator.
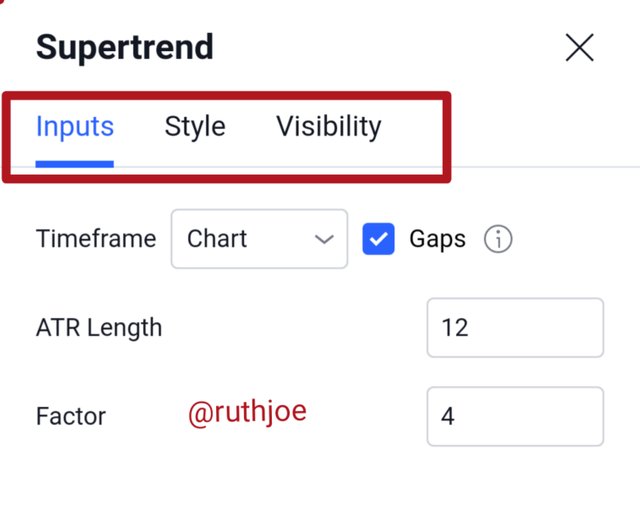
- First on the list is input, here you have to access the length of ATR for me I changed the length to 12, and the factor to 4.
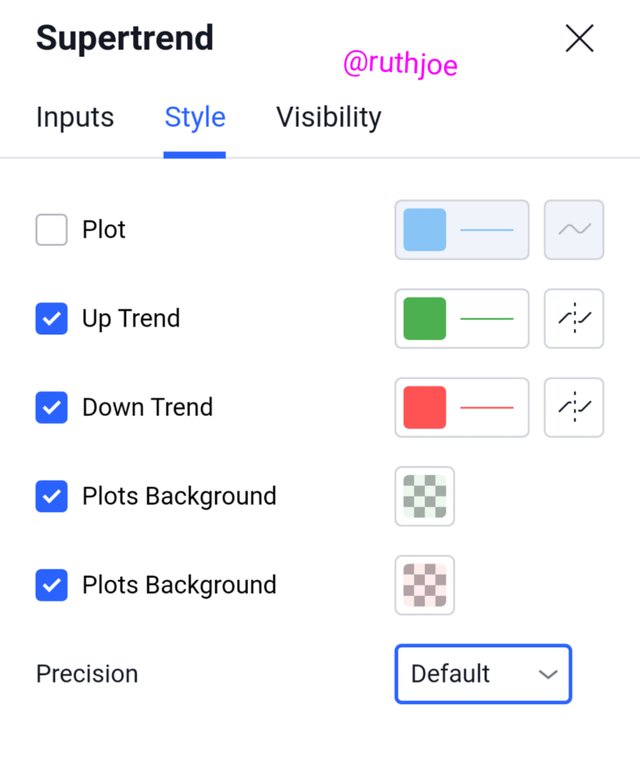
- Next is the style, co figuring this has to deal with how you want your chart colour to appear, the lines of uptrend and downtrend, from the screenshot I choosed various colors.
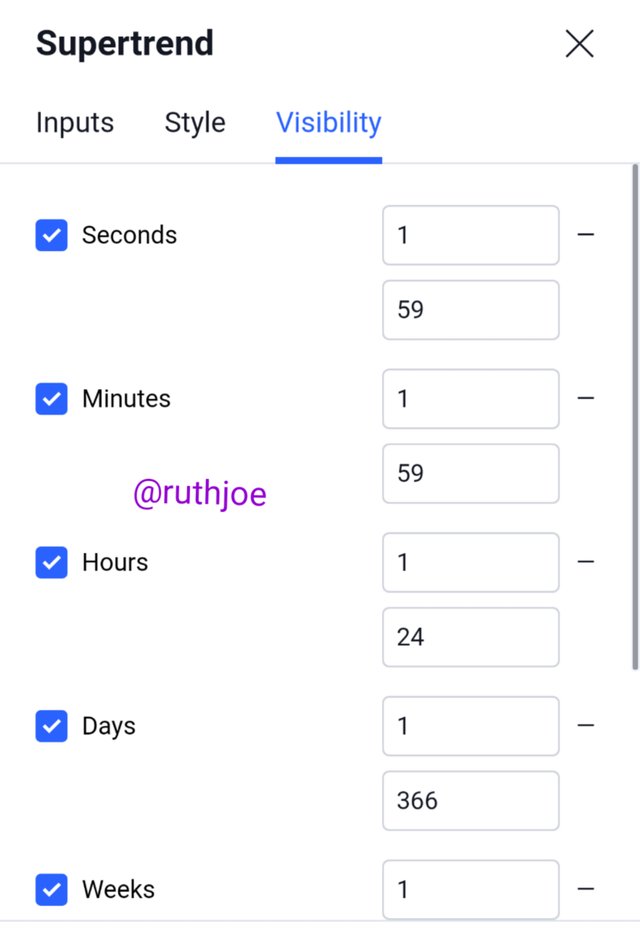
- Last on the configuration is the visibility, this has to do with timing, seconds, minute's, hours, daily, weekly, etc, you can decide to change the figure to suite your trading styles.
If it's available to change the default settings, for me I will say yes and no, to be precis it depends on what the trader wants like for me I want my supertrend Indicator lines to be a little bit wider so I decided to change the length to 12, and the factor to 4.
Based on the use of the SuperTend indicator, how can one predict whether the trend will be bullish or bearish (screenshot required)
We all know that trading is all about predicting what will happen in the market overall, trading in general is very volatile so one needs to be very careful, this Indicator gives good trading signals near accurately when overall market is trending.
In trading market we have two things Uptrend formation and downtrend formation that is bullish and bearish phase overall, intense of predict the phase of the market for bullish phase we have our eye on the closing price, if the Indicator flips over it the bull phase has been established.
Now let's say supertrend Indicator closed below the price by so doing the Indicator colour change to green, at this point a buy signal has been established.
For sell signal, it's just the vice-versa of bullish phase, at this point the supertrend Indicator must close above the price and the colour must change to red, at this point a sell signal has been established, in there is no technical Indicator that is 100% note this.
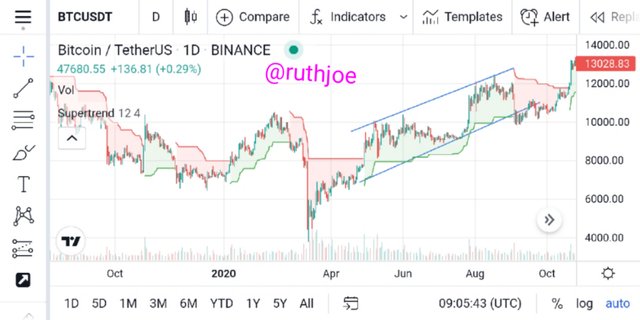
From what I have explained so far looking at the chart it's pretty simple to determine uptrend and downtrend formation's in the market overall, means to predict the phase on the market, firstly you must be good in market structures, you must know your support and resistance phase.
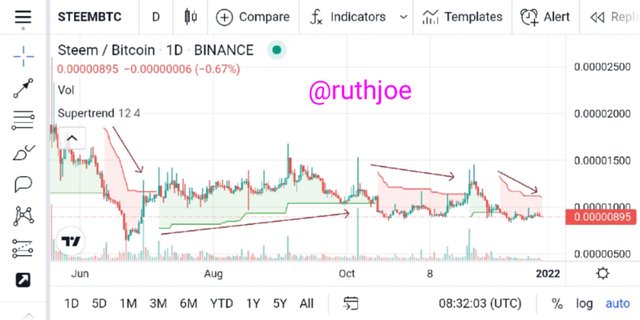
Since this Indicator works well in trending market, you will spot your support and resistance levels and draw a trend-line in conjunction with the various colour that emernates as a result of the Indicator been used, with this you can easily determine buy and sell using this Indicator, take a look at the chart below
From the chart my predictions are pretty correct I predicted uptrend and downtrend phase, all came to fruition, that's massive I exploited various tools to getting accurate buy and sell signals.
Explain how the Supertrend indicator is also used to understand sell / buy signals, by analyzing its different movements.(screenshot required)
This Indicator works just as other Indicators although none works 100%, just as I have earlier stated, with this Indicator you can determine a buy signal if only this Indicator closes below the price and it's colour changing to green
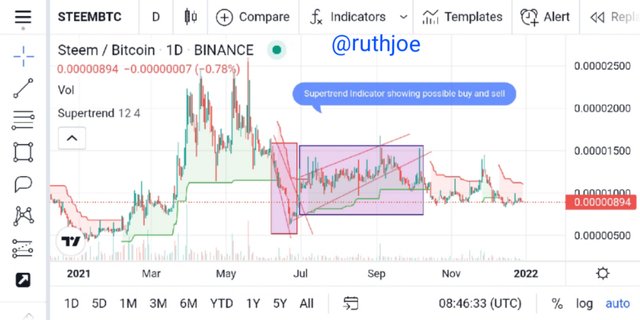
Looking at the chart you can easily understand buy signal, with the closing strategy and price actions and structural formations, for the buy signal there was series of higher-highs formations, that is basically the formations.
Using this Indicator to determine sell signal is just opposite of what happened in the determination of buy signal, here the Indicator has to close above the price, look at this chart below for clearer understanding.
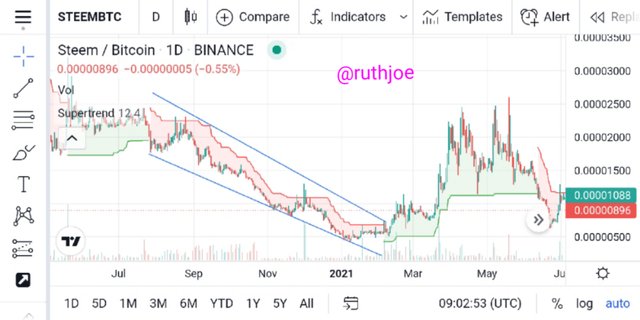
Analyzing various movements you will see clearly that price is forming series of lows, this higher-lows, and lower-lows as the case may be, Looking at the trend-line drawn you will see a clear downtrend untill there was a breakout price continued in downtrend.
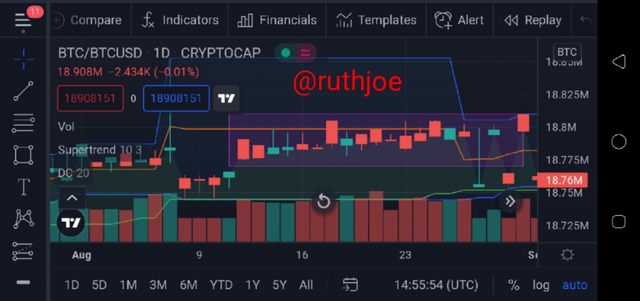
How can we determine breakout points using Supertrend and Donchian Channel indicators? Explain this based on a clear examples. (Screenshot required)
Before we proceed talking about determining break-out points using supertrend Indicator and donchain channel's, I will officially say that break-out is a period in time in a chart where Price outside a designated Support and resistance levels.
Donchain channel is an indicator that was officially invented by Richard Donchain, the aim of this Indicator is to taking the highest high, and the lowest low, of a specific period, the channel's is regarded as the areas where you have the highs and the lows.
We now know what Breakout means now intense of determining break-out points as a trader I will open a position when candle-stick migrates out of the donchain channel's.
Whenever supertrend Indicator surges up you only buy that means a buy signal has been established same thing is applicable courtesy sell phase, but false signal is totally innevitable here, take a look at this.
In case of a sell signal the supertrend Indicator will definitely get exhausted and try retracing down forming series of lows, by so doing there will be a change in trend at this point a downtrend will definitely be established, take a look at this.
Do you see the effectiveness of combining two SuperTrend indicators (fast and slow) in crypto trading? Explain this based on a clear example. (Screenshot required)
Just as our people usually say two head's are better than one, combining two supertrend Indicator is pretty good, that is confluence trading, crypto Trading is very volatile it requires good and quality trading strategy to explore the market overall.
For me I see a great effectiveness in combining multiple supertrend Indicator, here I will be combining supertrend Indicator and again donchain channel watch and see how effective it's going to be.
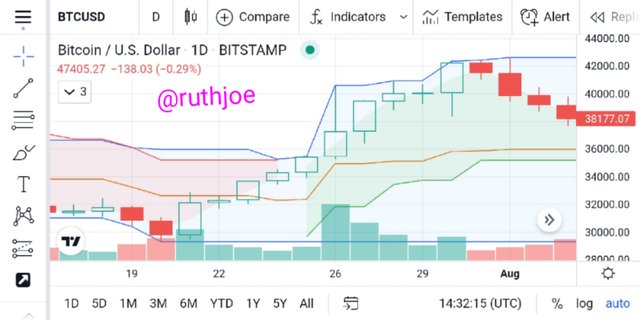
Looking at the chart apart from the formations been instituted you will see clearly that price are slow that is downtrending, you can see series of bearish candle-sticks, the most effective part here is when supertrend Indicator closes above the price then sell signal comes to fruition, just as we have seen above.
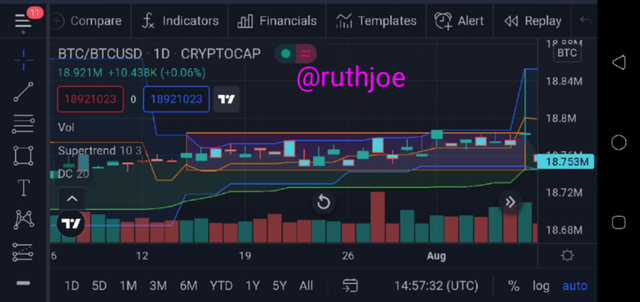
From the various candle-stick formations we see clearly series of bullish candle-sticks this signifies upsurge that is uptrend, looking at the chart clearly supertrend Indicator closing below the price that is buy signal been established.
Is there a need to pair another indicator to make this indicator work better as a filter and help get rid of false signals? Use a graphic to support your answer. (screenshot required)
Yes there is a very big need to pear two Indicators to make a supertrend Indicator work well/better, let's say a false signal came to fruition using only one Indicator you may not be capable to determine it, but with the use of multiple Indicators it's very possible to be detected.
In trading the existence of false signal is totally innevitable but the ability to detect it is key, always remember that no Indicator is 100% sure every Indicator has its own up and downs it depends on the trader to maximize the market based on structurized strategy.
Here I will be combining supertrend Indicator with RSI Indicator, let's filter out false signals, I see false signal as a distortion whenever price is forming highs or lows in a good phase, let's say price was forming series of higher-highs.
And all of a sudden you see a bearish candle-stick trying to distort the current formations, at that point I regard that as a false signal because after some minutes price will keep climaxing courtesy the instituted formation, look at some few examples below.
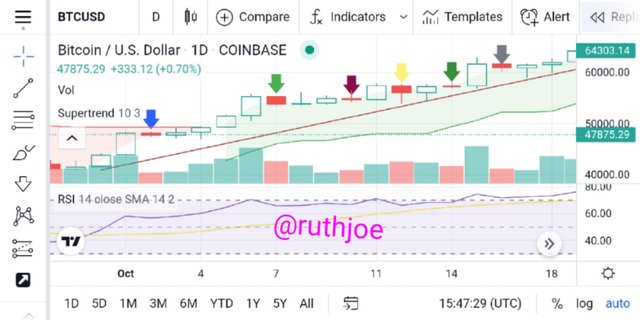
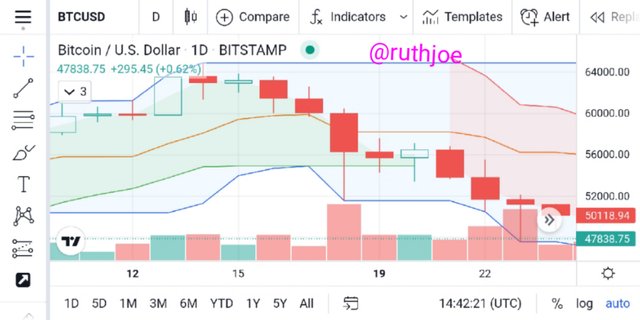
Looking at the chart above BTC/USD, you will see clearly that price was of a great uptrend formation but we have few false bearish candles, trying to distort the uptrend formation, but the formation continue.
One thing about false signal is that traders May be forced to close position not knowing that the signal instituted is false, looking at the chart higher-high continued.
List the advantages and disadvantages of the Supertrend indicator
Just as we know anything that has Advantage will surely have disadvantages too, here I will explore the pros and cons keep reading below and watch how it unfolds.
| Advantage | Disadvantages. |
|---|---|
| In a designated time supertrend Indicator provides accurate trading signal, intense of availability it is very much available in various trading platforms for free. | Supertrend Indicator doesn't suite all market it's totally inappropriate in major market overall. |
| Using supertrend Indicator you can easily make quick decisions, as it works best in a trending market, | Supertrend Indicator provides false signal most times in a trending market. |
| Supertrend Indicator suites various trading platforms like the forex Market, crypto market, and futures market, it can be exploited with proper risk management system | Supertrend Indicator in-conjunction with other Indicators provides divergence, that means the Indicator isn't 100%. |
Conclusion
Nice lectures from you professor @kouba01, you really did well explaining this in details, from my homework task I highlighted that supertrend Indicator is defined and plotted against price by so doing you can easily detect the current trend, this Indicator basically deals with two basic things namely period and multiplier.
I showed how this Indicator can be configured where I changed the length to my taste, I also highlighted the fact that when supertrend Indicator closes below price and the colour changes to green then a buy signal has come to fruition, for sell signal the Indicator has to close above the price and red colour comes to fruition.
Once again thank you very much professor Kouba01, Note apart from the screenshots sourced all other images are all my own work, thanks for your understanding.
Cc;@kouba01.