[Technical Indicators 2 by @rosita-nkefor] - Crypto Academy / S4W4- Homework Post for @reminiscence01".
Greetings dear students and professors. Please find presented below my homework post on the task lectured by professor @reminiscence01.

Technical Indicators 2 by @rosita-nkefor
a) Explain Leading and Lagging indicators in detail. Also, give examples of each of them.
Firstly, I will like to define what technical indicators are. Technical indicators in the cryptocurrency world can be defined as certain calculations based on previous market behaviors, price movements, and demand and supply in the form of a graph, that are used to foresee future market dynamics. These indicators can be grouped into two types; the leading and the lagging indicators.
One type of technical indicator is the leading indicator. As the name suggests, these are indicators that send signals before it occurs in the market. That is, with such an indicator, a trader will be able to spot any movement in price before it happens. This is good in that it allows any trader to easily follow a trend or enter a tree on time. But as we know, every good thing has its bad traits.
These indicators are very vulnerable to change. That is, within the period of sending the signal and the predicted price movement, something can happen that may change the predicted movement. Due to this, you may get fake signals and make a wrong move while the price moves in a different direction than expected. This is the reason why you should not use leading indicators alone, to minimize manipulation from false signals.
These indicators are most suitable for short-term trends. Examples of leading indicators include the following;
- Stochastic oscillator
- Relative Strength Index
- Williams %R
- Moving Average etc.
The other type of indicator in trading analysis is the lagging indicator. These indicators are the type that rather send signals about a price prediction after it had occurred already in the market. That is, when price moves in the market, they come to confirm that movement.
These indicators unlike the leading indicators are very resistant to change. This is because whatever movement is experienced in the market, the signal is generated only after it. So there are little or no false signals sent to the trader. Because of this, they are most suitable for long-term trades.
Unfortunately, when such indicators send you a signal, the trend in the market has already started. So you miss out on very good deals and if you are not careful, you might enter a trade when the trend is already reversing. It is for this reason that should best be used for confirming movements along with the charts.
Examples of these indicators include the following;
- Simple Moving Average
- Bollinger bands
- Moving Average Convergence Divergence etc.
b) With relevant screenshots from your chart, give a technical explanation of the market reaction on any of the examples given in question 1a. Do this for both leading and lagging indicators.
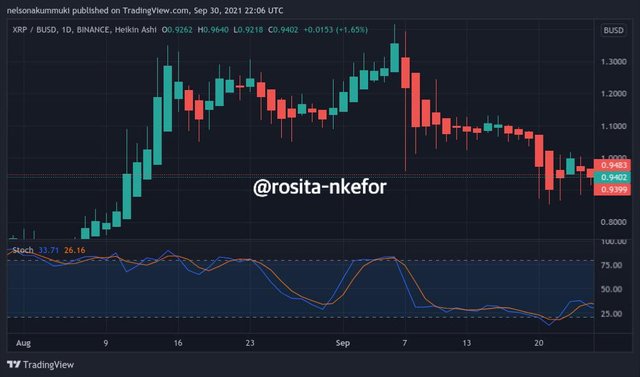
For this example, I have chosen the stochastic oscillator. If you look closely at the chart, you can see that the indicator signaled before the price followed. The gap is not too large for it to be highly observable but if you look at it closely, you can see that it comes first.
So this is an example of a leading indicator in action.
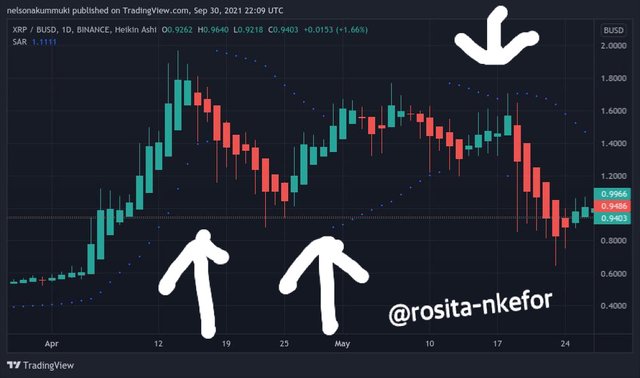
For this purpose example, I used the Bollinger bands indicator. Looking closely at the chart, you can see that the price hits a peak and starts descending before a similar peak is seen in the indicator.
Also, the price goes down to its lowest level point before we see an identical reaction with the indicator. This is a clear example showing the behavior of a lagging indicator.
a) What are the factors to consider when using an indicator?
There are several existing indicators in the trading world. Now how do you choose the best indicator to trade with? Choosing an indicator will depend on the following factors;
Understand your trading strategy: Before you even start trading, you have to know yourself as a trader and comprehend your trading strategy. This is a very important factor. Why? Because if you are a short-term trader, you will generally work best with leafing indicators and good short-term indicators. On the other hand, if you are a long-term trader, then lagging indicators will be best suited to your strategy.
Understand the trend in the market: Crypto markets are typically either in a range or in a trend. Each of these market conditions is going to require specific types of indicators for effective trading. That is when the market is in a range, a trader will prefer to use momentum or volatility-based indicators. But when the market is in a trend, a trader will instead use indicators that follow market trends.
Understand the indicator type: We will also have to consider the type of indicator when choosing our indicators to use. As we have seen already, indicators can either be leading or lagging. So if we know the type of indicator we want to use, we'll also know its weaknesses and when best to use these indicators.
Find a confluence: This is another important factor when choosing indicators. It will make for effective trading if you can find a confluence between two or more indicators. When you do so, it now narrows down the indicators you should choose.
b) Explain confluence in cryptocurrency trading. Pick a cryptocurrency pair of your choice and analyze the crypto pair using a confluence of any technical indicator and other technical analysis tools. (Screenshot of your chart is required ).
In the world of crypto, a confluence refers to the event that two technical analysis tools agree on the same thing. That is, their signals are complementary to each other. It is a very important thing because we know that indicators are best used together with others. So the more indicators agree with each other, the more positive or true the signal will be. This eliminates fake-outs and false signals in trading.
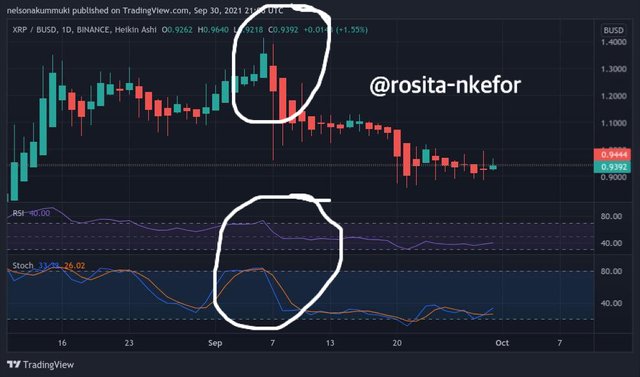
For this example, I used the Relative Strength Index indicator and the Stochastic oscillator.
If you observe the circled regions, you see that both indicators went above the 80 mark into the overbought region. So both indicators were in a confluence.
And we can see from the chart that the price also created in the same way. This is a clear example of a confluence between indicators in a crypto market.
NB: All screenshots were taken from the XRP/BUSD chart on https://www.binance.com/
a) Explain how you can filter false signals from an indicator.
Most times, indicators send out false signals to traders which makes them take wrong decisions. But a trader does not always have to fall for these false signals. These signals can be filtered in the following way.
Always check the market to see if it reacted to the signal given. When indicators send out their signals, the market might react positively to the signal or in the opposite direction. So it is best to analyze the market using price action to see what the market is telling you instead of solely relying on the indicator's signal. This is because sometimes the trend in the market is so strong that it may take a very long time to enter a reversal despite what the indicator is signaling.
What we are saying is that a combination of the price action strategy and the technical indicators strategy is best to filter out false signals.
b) Explain your understanding of divergences and how they can help in making a good trading decision.
Divergences in cryptocurrency, refer to the event where the price of a good is instead moving in an opposite direction to the technical indicator being used. That is when the indicator signals a movement, the price diverges away from that prediction completely.
There are two types of divergences namely; the bullish and the bearish divergence.
Divergences are very useful in that they provide information that can help us to filter false signals. They also provide the trader with useful information on any potential reversal of the price movement.
c) Using relevant screenshots and an indicator of your choice, explain bullish and bearish divergences on any cryptocurrency pair.
This is a specific type of divergence, whereby when the indicator suggests a trend moving up by forming a lower high (price is moving upwards but is still relatively low), the price rather suggests a trend that moving downwards by forming a lower low (moving down but relatively low).
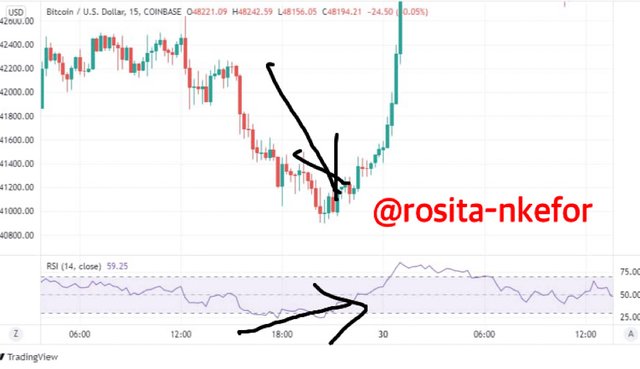
From this chart, if we draw arrows, we will we that at that point, while the RSI indicator suggests an upward trend, the price movement instead shows a downward trend. This is why this divergence is bullish in nature.
This is the type of divergence where when the indicator forms a lower high, the price instead suggests the formation of a higher high.
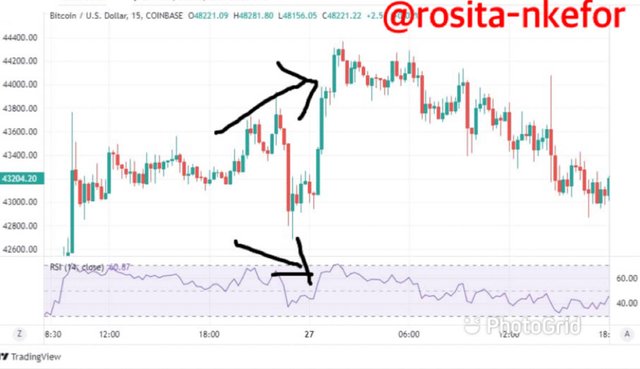
From the chart, we can see that while the RSI indicator suggests a downward trend, the actual price movement indicates an upward trend. This makes the divergence to be bearish.
NB: These last two screenshots were gotten from a BTCUSD chart on https://www.tradingview.com/
Conclusion
From the lecture, I was able to absorb knowledge on the different types of indicators. I also understood the factors to consider when choosing an indicator for trading. Equally, I understood how to filter out false signals to minimize losses made in trading due to wrong decisions.
I learnt all about confluences, divergences and how a trader can benefit from them for effective trading.
Thanks for reading.
Hello @rosita-nkefor , I’m glad you participated in the 4th week Season 4 of the Beginner’s class at the Steemit Crypto Academy. Your grades in this task are as follows:
Observations:
Recommendation / Feedback:
Thank you for participating in this homework task.
Thank you professor