Align Technology Needs Some Realignment

Align Technology, Inc. designs, manufactures, and markets a system of clear aligner therapy, intraoral scanners, and computer-aided design and computer-aided manufacturing (CAD/CAM) digital services. The company's Clear Aligner segment offers Invisalign Full, a treatment used for a range of malocclusion; Invisalign Teen treatment that addresses orthodontic needs of teenage patients, such as compliance indicators, compensation for tooth eruption, and six free single arch replacement aligners; and Invisalign Assist treatment for anterior alignment and aesthetically-oriented cases.
If you haven’t read the title of this post, you might of thought you were looking at a chart of Facebook or Netflix.
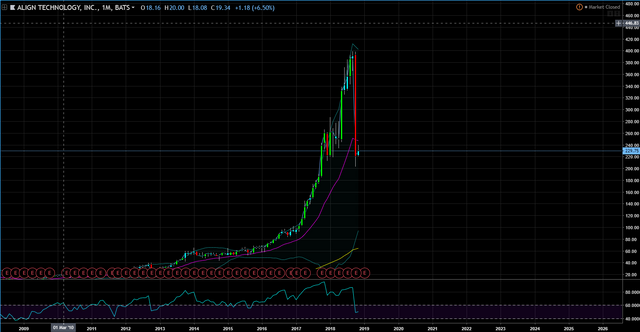
Nope, this is the chart of Align Technology. Align Technology, Inc. designs, manufactures, and markets a system of clear aligner therapy, intraoral scanners, and computer-aided design and computer-aided manufacturing (CAD/CAM) digital services. Align Technology is famous for making the Invisalign.

For the third quarter, Align reported earnings of $1.24 per share, rising nearly 23% to top the average of analysts polled by Zacks Investment Research for $1.19. Sales of $505.3 million grew more than 31%, and beat expectations for $501 million.
During the third quarter, Align shipped 319,345 Invisalign cases. Revenue stemming from Invisalign aligners as well as SmartDirectClub aligners — another type of at-home teeth straightener — climbed 25% during the third quarter to $427.1 million.
However, forward guidance is all that matters on Wall Street. The stock crashed 25% because they forecasted earnings of $1.10-$1.15/share, but analysts were looking for earnings of $1.32 per/share. The culprit was lower average selling prices for the Invisalign clear aligners due to the company running promotional programs during the third quarter that included discounts for its clear aligners and product mix changes. The CEO said the promotional programs are temporary, so the current issue seems to be temporary.
With minimal to no competition and the opportunity to grow still in the US and overseas, lets go to the charts to see if drop in price presents a buying opportunity.
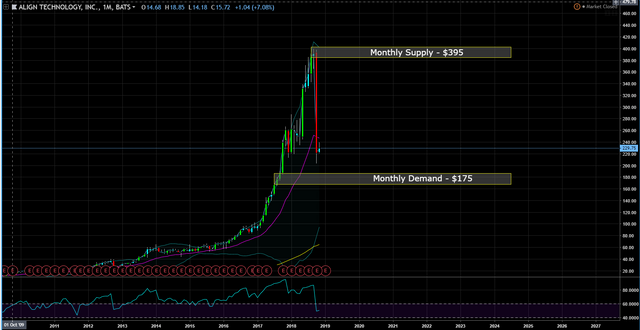
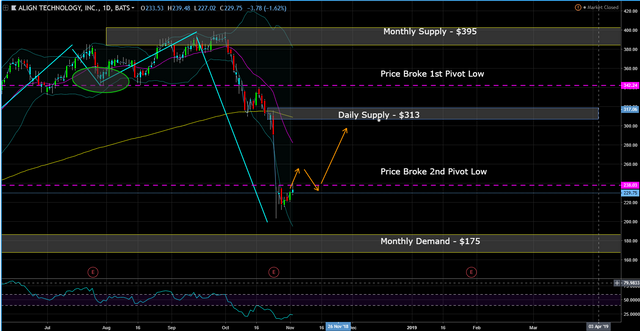
Monthly Chart (Curve Timeframe) – monthly supply is at $395 and monthly demand at $175.
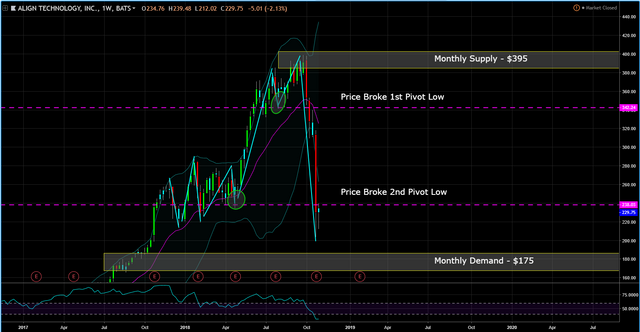
Weekly Chart (Trend Timeframe) – the trend is down based on the huge drop in price,
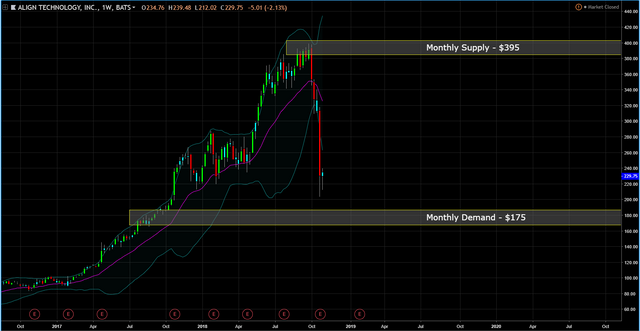
but lets go through the process of determining the down trend....a break of two pivot lows.
Daily Chart (Entry) – the chart suggests if price can breakout of the current basing, then pull back, price will close the gap with a target at the daily supply at $313.
This post is my personal opinion. I’m not a financial advisor, this isn't financial advise. Do your own research before making investment decisions.
