Administering Icinga2 - Server Monitoring Tool
In the company that i am working we are using Icinga2 as our server monitoring tool. It really helps me to be able check whether a server has a problem with its CPU usage, memory , security related or disk problem. You can set Administrator email account there so you can received a notification whenever there is a problem.
In settings up Icinga2 it is quite easy you need a physical server or a virtual machine , as long as it meets the minimum requirements. I would recommend if you can have above the minimum requirements to avoid any problem during your monitoring.
In this monitoring tool , it helps you lessen your time checking one by one on the server since in your first glance you can easy see what server has a problem and what are its problems. All of them are graphical where you can see clearly the server alerts and see some logs if you want to be tracing something.
It is very easy and convenient because with such a human readable error alert notification to administrator , you can easily fix the problematic server since the error is captured by the monitoring tool and there will be less time troubleshooting.
The best of it that it has service checking and application checking to each of the server , you just define a script into your configuration and it will automatically be added as one of the monitored services.
What is Icinga2?

Screenshot from Icinga2 websiteIcinga2 is an Opensource application which has the ability to check and monitor your server.Icinga2 have a fast performance and very light weight monitoring tool. It can even runs thousands of checking for any CPU without any slowing down its performance. Its application installer can be downloaded for free in their website so you can install Icinga2 monitoring server to your linux based operating system.
Website : https://www.icinga.com/products/icinga-2/
Github Repository : https://github.com/Icinga/icinga2
Icinga2 Login Window
This is Icinga2's login window where you can see username and password there. You just input your administrator credential to be able to access the server monitoring tool.

Screenshot from Icinga2 applicationIcinga2 Server Layout
Once you have successfully login into your Icinga2 Monitoring Server you will be redirect to the icinga2 dashboard. On your left side are menu options and then on the center of the screen you can see the status of each server whether they are running ok or not.
You can see clearly those who have problem where they are colored red and then violet for those servers that needs attention. For servers that have no problem you can see that they are colored green with it and maked as OK with the time that the server has been running for long.

Screenshot from Icinga2 applicationMenu Options Layout
In the left side are Menu Options. Each of them have different functions that can be useful for your server monitoring
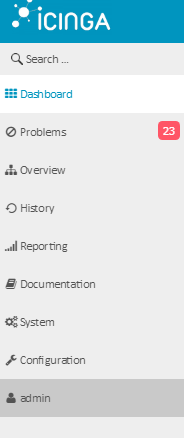
Screenshot from Icinga2 applicationList of Menu
Dashboard - This is where you can easily see all your server's performance
Problems - In this section you can see all problematic servers
Overview - You can see some overviews from all your monitored servers
History - In this section you will see all your server history
Reporting - Here you can see some reports from your monitored server
Documentation - In this section you can see some manuals which can help you in monitoring servers
System - Here you can see the system related settings that will be applicable for your server
Configuration - Here you can configure some settings for your Icinga2 server
admin - Here you can see who is currently login
Problem Menu
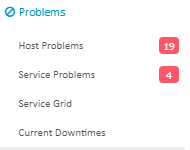
Screenshot from Icinga2 applicationHost Problems - Here you can see servers that have problems
Service Problem - Here you can see services that have problems
Service Grid - Here you can see service grids
Current Downtimes - Here you can see servers that are in downtime state
Downtime Menu
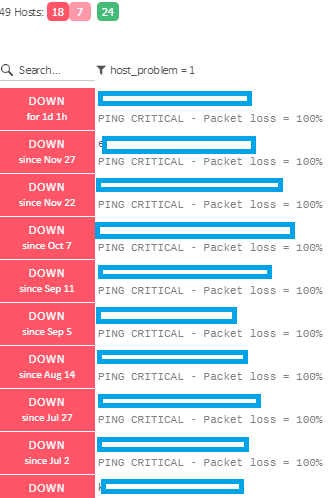
Here you can see a list of servers that have downtime issues. You can see when did the downtime started so you could able to check the server immediately if the time frame is quite long enough.Then the details also stating the packets of the ping.
Screenshot from Icinga2 applicationService Problems Menu
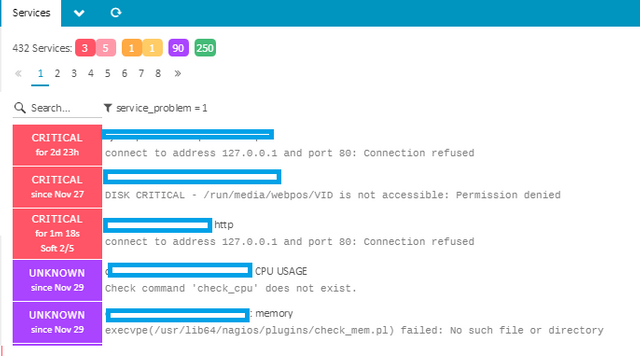
Here you can the services that have problems. There is also indication what type of service problem the server had been experiencing.
Screenshot from Icinga2 applicationService Grid Menu
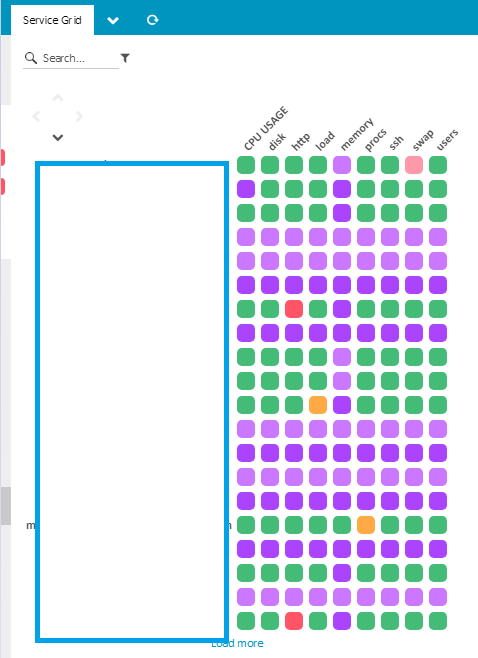
In Service Grid Menu you can see clearly server status since it is indicated there that each of the service have their services and cpu related process are colored in squares. For colored squares : Green if your server is running ok, Red if your server had problems and Violet if your server needs attention.
Screenshot from Icinga2 applicationOverview Menu
Here you can see an overview of your selected options
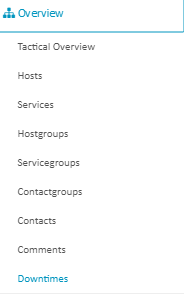
Screenshot from Icinga2 applicationTactical Overview - You can see clearly all the overview of your server
Host - You can see the list of your host here
Services - You can see a list of services that you are monitoring here
Hostgroups - You can see hostgroup servers here
Servicegroups - You can see Service groups here
Contactgroups - You can set contact groups here
Contacts - Sets you contacts
Comment - See some comments that you have noted
*Downtimes - You can see all your downtime logs *
History Menu
Here you can see the history of errors on your monitored server
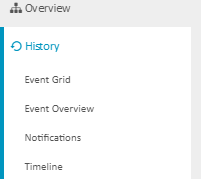
Screenshot from Icinga2 applicationEvent Grid - Here you can see the errors in event grid
Event Overview - See some errors in a more presentable way
Notifcations - See some list of notifications received
***Timeline *- See a list of problematic server with their timeline
Advantages of this Application
- Easy monitoring and Server checking
- Faster server monitoring
- More manageable and flexible to use
- Easy configuring the server
Posted on Utopian.io - Rewarding Open Source Contributors
great post!
again @five34a4b , you are most welcome. You are been my frequent reader , and that is good.
Thanks for the nice post...Well done
thank you very much @tenorbalonzo for checking. =)
Thank you for the contribution. It has been approved.
You can contact us on Discord.
[utopian-moderator]
thank you @shreyasgune for checking my contributing and approving. It is very appreciated.
Hey @robin-ho I am @utopian-io. I have just upvoted you!
Achievements
Community-Driven Witness!
I am the first and only Steem Community-Driven Witness. Participate on Discord. Lets GROW TOGETHER!
Up-vote this comment to grow my power and help Open Source contributions like this one. Want to chat? Join me on Discord https://discord.gg/Pc8HG9x