[Crypto Trading with Moving Average]- Steemit Crypto Academy | S6W2 | Homework Post for @shemul21
Hi steemians !!
I've been inactive on steemit for a very long time, lately I've been really busy so I didn't have time to post. For the past 10 months, I have only traded on various exchange platforms. However, I got information from one of my friends that in steemit there is already a crypto Academy community that discusses various issues around cryptocurrencies. I was intrigued, and immediately studied it. And this is my first post on Steemit Crypto Academy.

1. My Understanding of Moving Average.

In traditional technical analysis, the moving average is an algorithm, that is, a mathematical tool that allows, through a formula, to derive a synthetic indicator of the price trend of a financial asset.
It is a technical index that calculates the average value of prices for a certain period and represents it with a single line. This indicator is commonly used by traders. A Moving Average is a line chart that is drawn around a candlestick and connects the average closing price over a certain period of time, and is representative of trend analysis.
Moving averages allow us to analyze the historical movement of asset prices and forecast support and resistance levels, they can also be used to help highlight trends, trend reversals, etc. It is also one of the most used technical indicators investors use when predicting future fluctuations, as it is effective in finding trading signals by examining past price fluctuations and combining them with other technical indicators. In addition, there are leading indicators and technically lagging indicators. While the moving average is included in the category of lagging indicators.
A certain amount of data is required to calculate the moving average. Depending on the length of the period we want to calculate, the amount of data required may be very large. For example, a 10-day moving average requires 10 days of data, and a 1-year moving average requires 1 year of data.
Generally, moving average calculations take into account the closing price of a financial market session, but maximum, minimum, or session opening values can also be used. This reasoning also applies to the time frame used moving averages can also be calculated on a chart with weekly, monthly, hourly candles. In this case the 'N' periods considered by each moving average would concern the time range summarized by a single candle or bar chart.
With the Moving Average we can determine the entry and exit points. The way the indicator works is also very easy to understand, if the moving average line moves above the price action then this indicates a downtrend, and if the moving average line moves below the price then this indicates an uptrend.
Meanwhile, to find entry and exit points, we only need to wait for the moving average line to change, when the Moving Average line rises above the price action it is an exit point and when the moving average drops below the price action it is an entry point.
This indicator is referred to as "moving" because the chart lines "move" in such a way that they connect new data.

2. Types of moving averages and their differences.

There are 3 moving averages that are most popular among traders, including: Simple Moving Average (SMA), Exponential Moving Average (EMA), and Weighted Moving Average (WMA).
- Simple Moving Average (SMA)
The Simple Moving Average (SMA) is the classic arithmetic average of prices. It is calculated by adding the closing prices of N time periods and dividing the result obtained by N.
The Simple Moving Average (SMA) Literally, is a moving average line consisting of numbers that is simply the average of closing prices over a certain period of time and is the most basic Moving Average (SMA). To calculate the 10-day SMA, simply divide the total price for the last 10 days by 10.
For example, if the asset data for the last 10 days was 80, 81, 81, 82, 80, 82, 89, 82, 82, 83, then the moving average is 82.2, which is the sum of these divided by 10.
- Weighted Moving Average (WMA)
In the case of the 5-day Weighted Moving Average line, the price on the 5th day is multiplied by 5, the price on the 4th day is multiplied by 4, the price on the 3rd day is tripled, and the price on the 2nd day is doubled. This allows us to focus our analysis on recent prices rather than simple moving averages.
The Weighted Moving Average (WMA) is also a classic arithmetic average of prices that gives more weight to recent data and less to data further in time.
Take for example the 10-period moving average, the close of the tenth and last day multiplied by 10, the close of the previous (ninth) day by nine, the close of the eighth day by eight and so on. The total will then be divided by the number of multiples thereof. Therefore, the WMA is much more reactive to recent events, while it “muffles” past fluctuations.
- Exponential Moving Average (EMA)
On the other hand, the Exponential Moving Average focuses on the latest prices and makes them sensitive to new information. It is calculated by doubling the most recent price. For the 5-day EMA, the price on day 5 is multiplied, added and divided by 5.
The Exponential Moving Average (EMA) has a more complex calculation method than the previous two methods. In the exponential moving average formula, all data from the historical price series are considered, with the weights decreasing exponentially. The weighting of the first data from the series will decrease over time until it becomes very small, but will always be included in the calculation. Basically, the entire history of the security is taken into account in the EMA calculation.
| SMA | EMA | WMA |
|---|---|---|
| Simpler and easier to use, especially on longer periods | Can be used on all timeframes, but most effective short term trading | Effectively used on all types of timeframes, both short and long. |
| SMA is just the average closing price over a certain period of time | The EMA focuses on the latest price which is more sensitive to new information and is also calculated by doubling the latest price | WMA reduces recent data to make it more balanced and usable across all timeframes. |
| SMA only calculates the average price of a certain time period | EMA is more specific because it calculates based on current trends and data | WMA is more focused on recent data and calculating averages |
| Since it is a lagging indicator, SMA is the laggard of the other three | EMA is the fastest among the three | WMA is not faster than EMA but faster than SMA |

3. Entry and Exit Points With Moving Average.

Actually there are several ways to detect entry and exit points, such as combining two MA indicators and waiting for the golden cross and death cross signals. But we don't need to complicate the discussion just to make it look long or to appear as if our horizons are very broad. I will personally explain to the core points of the MA indicator to detect entry and exit points.
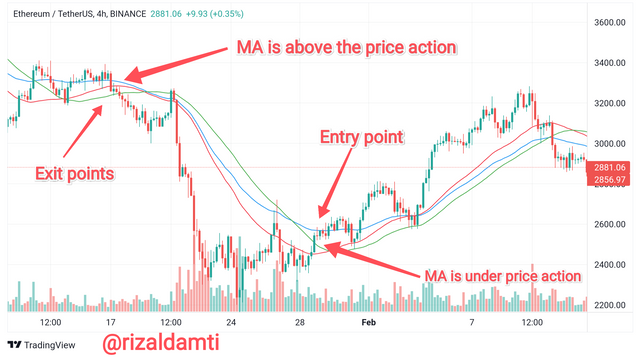
Of the three MA indicators (EMA, SMA, WMA), have a similar way of working. When the SMA, EMA, and WMA lines start to move above the price action, then this is a clear exit point and we should exit the market immediately and take profits. And when the SMA, EMA, and WMA lines start to move below the price action, then this is an entry signal that we should take advantage of to immediately place a buy order.
For example, consider the graph below.
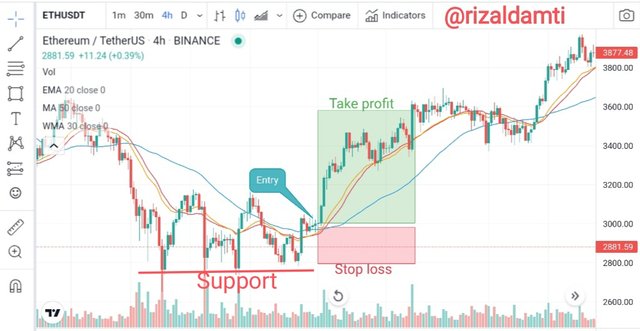
Here I have illustrated how the three MA indicators work in determining entry points, take profits, and stop losses. The MA line begins to move down below the price, and this is an entry point for us to immediately place an entry point.
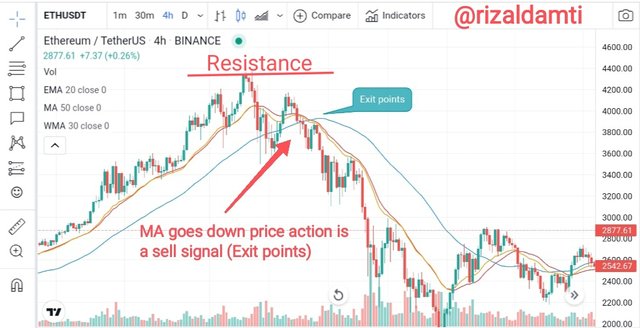
As for the exit points, we only need to pay attention to the line from the MA indicator. When the MA line begins to move above the price, we must immediately get out of the market.

4. My Understanding about Crossover.

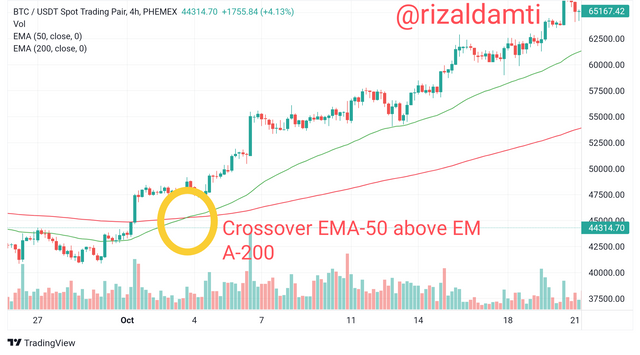
I will try to explain crossover in a simple and understandable way. New crossovers may occur if we combine two MA indicators at once with different periods, one is slow, while the other is fast. For example, we use two EMA indicators at once with periods of 50 and 200.
In the analysis, the crossover of the MA is also known as the golden cross and death cross. When the fast EMA (50 EMA) crosses above the slow EMA line (200 EMA), this is also known as a golden cross, and it is a clear signal to enter the market immediately and place a buy order as it is expected to occur soon. uptrend.
However, if the fast EMA moves below the slow EMA, i.e. the EMA-50 line drops below the EMA-200 line, then this is also known as a death cross. This is a signal for us to get out of the market as soon as a downtrend is expected.
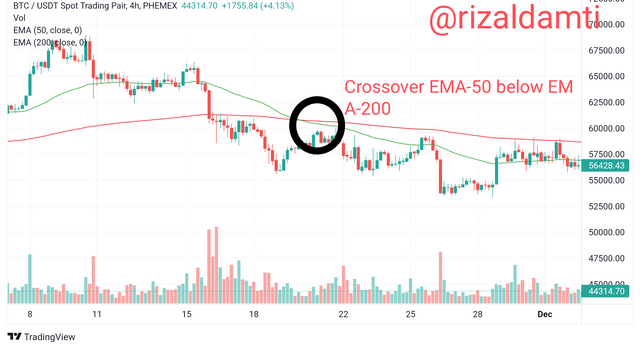
In conclusion, the crossover of the MA indicator is also known as the death cross and the golden cross. Where we will combine two MA indicators with fast and slow configurations, if the fast MA moves above the slow MA then this is a crossover which indicates an uptrend signal will soon occur. Meanwhile, if the fast MA moves below the slower MA, then this is a signal that a downtrend will soon occur.
So, we can take advantage of these two crossovers as buy and sell signals. How?, Look at the graph below.
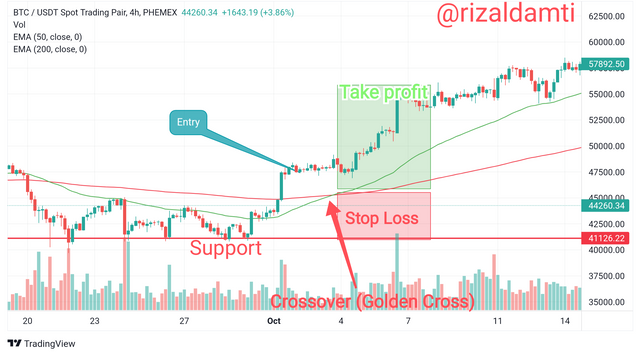
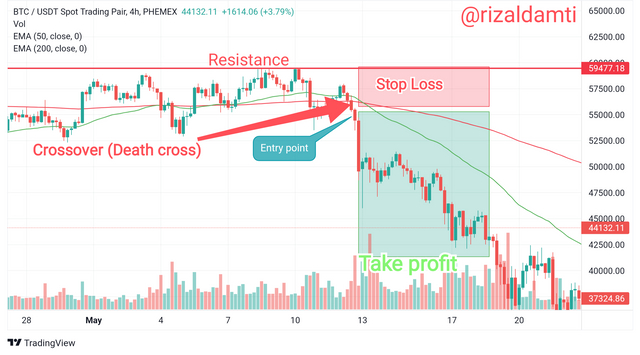
That's how to take advantage of the Death cross and golden cross crossover signals from the moving average indicator.

5. The Limitations of Moving Average.

Although this is an indicator that is widely used because of its simplicity, there are still shortcomings and limitations in conducting the analysis. No one indicator is perfect, all indicators have advantages and disadvantages. So here are some limitations of the moving average indicator.
When the market price is in a sideways stage, the buying and selling signals issued by the moving average are too frequent, which is easy for investors to make wrong judgments.
The moving average indicator does not take into account data outside the average period, so this is a separate weakness for the Moving Average indicator.
Moving averages naturally look back. This is what gives a lagging effect on the developing trend so that it gives a late signal, Moving Averages rely on past data that can never be applied with confidence about the future.
Moving averages are also unable to respond to downward fluctuations as well as complex price movements within a certain period.

Conclusion

From all the descriptions above, we can draw several conclusions. First about the features of the Moving Average indicator. Moving averages do well in a directional trend, and give false signals in flats and triangles. In addition, when optimizing the moving average period, there is a risk of overfit (overfitting the indicator to the selected chart fragment, which makes it useless when testing other data)
The way the moving average indicator works is also easy to understand, there are several signals given by the Moving Average that can be understood easily. For example, if the price is above the indicator line, it is considered an uptrend. And if the price is below the Moving Average, then the trend is most likely bearish. Crossovers of moving averages from different periods are a signal of a change in trend.