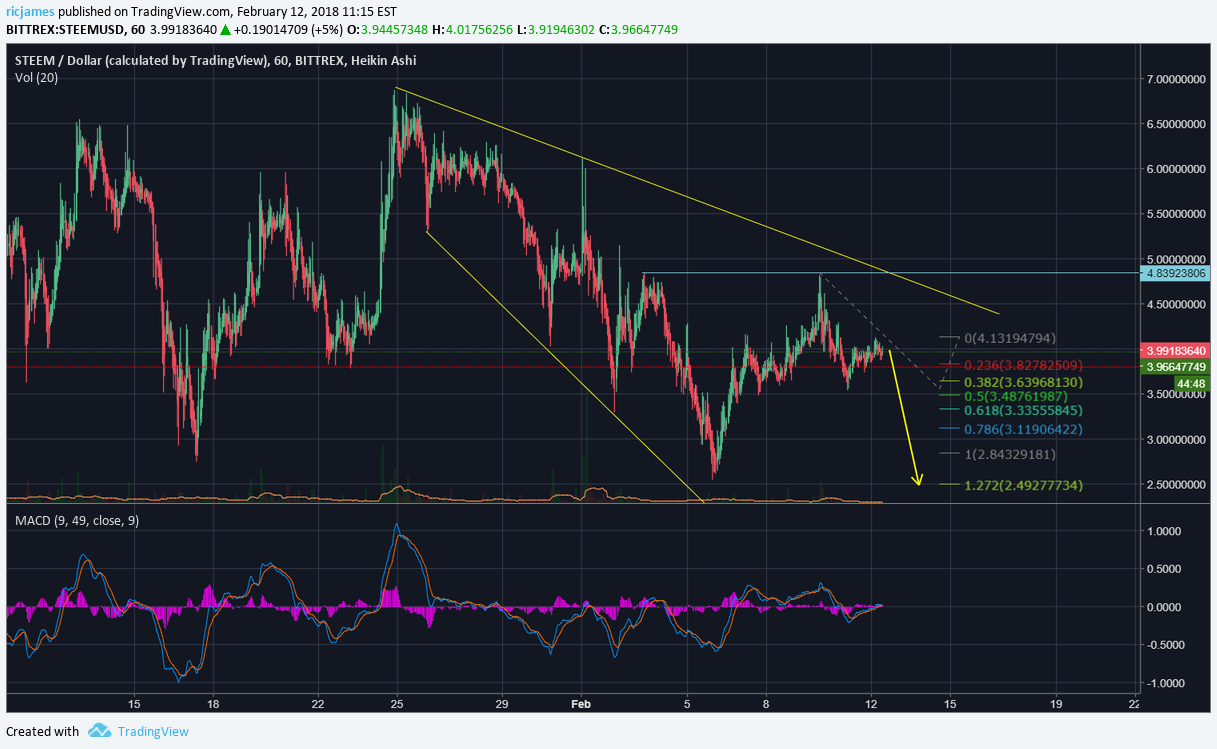
Technical Analysis: Steem - Feb 12th

Steem didn't do much yesterday in terms of movement and I am still waiting for the next move to the downside. We have been experiencing lower highs and lower lows as we've been trading within this descending broadening wedge. Looking at the Fib extension located on the right side of the chart we should see Steem break to the downside taking out the prior low and finding a bottom around the $2.50 mark. If the price happens to break out of the pattern or take out the prior high it will be a strong buy as we will have most likely broken out of our current trend and be very bullish on the chart.