[CRYPTO TRADING STRATEGY WITH MEDIAN INDICATOR]- Steemit Crypto Academy- Homework post for Professor @abdu.navi03 by @rexiano


Hello steemians. Welcome to my last task of the week. This task is about the Median indicator and how it can be used to make good trading analysis as well as how we can use this indicator in confluence with other trading indicators and make good trading activity. I will go about this task by answering the questions given by my professor after the lesson was taught.
The median indicator is a trend following indicator that can be used to catch price trends of cryptocurrency assets such that the trader can make good use of this information as well as can use this indicator as a direct trading strategy when in confluence with other indicators or trading tools. This indicator measures the direction of the market by taking into account the market volatility such that it forms a simple line on the chart that describes its activities based on price action of the cryptocurrency asset.
This indicator is represented by a line like I said above, which may oscillate on the price chart giving different signals to the trader about the different trends that appear in the market based on its calculations and configuration before use. The said line acts just like the moving average lines when using the moving average indicators. This indicator changes colors when trends change on the price chart. For example when configured and the purple color appears for bear market and the green color for bull market it will tend to show this color difference all the time throughout its oscillation with the price.
The crossover of the thick median line is an indication of trend change. If the purple median line appears we know that we have a downtrend and when the green median line appears we know that we now have a bullish market. During these switches traders can make entry and also exit the market using the median indicator. The thick median line also acts as support and resistance on the price movement. This can be seen whenever the price hits the median and moves away from it only to hit again until the median color changes for the opposite trend. We shall see these from the coming sections on this task.
The median I indicator like other trend following indicators has its own parameters that have to be taken into consideration during configuration. I will add the median indicator on the price chart of BTCUSDT on Tradingview platform and do some parameter identification.
To add this indicator we take the following steps
Firstly, we get to our trading platform. In this case i'm using Tradingview and I will just visit the site as seen on the screenshot below. I will use the chart section and precisely BTCUSDT trading pair.
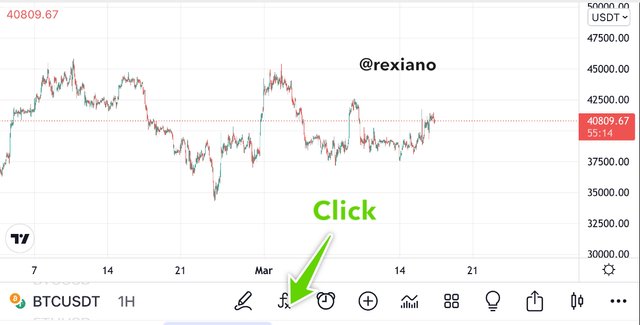
On the above screenshot I clicked on the indicator icon and the next page will show you a text box to type your indicator name and click on the indicator of your choice. This is seen on the screenshot below with a pictorial explanation..
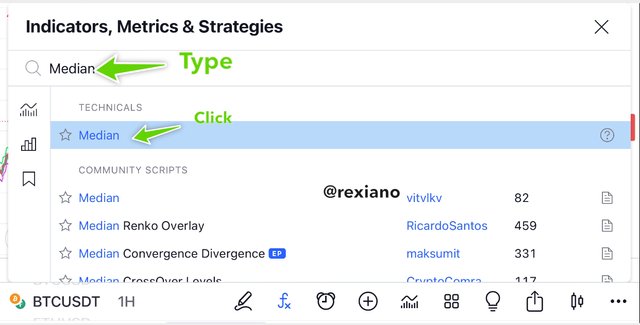
After clicking on the indicator as seen above, we will see that the indicator has been added to our chart. At this point we can go ahead to configure our indicator.
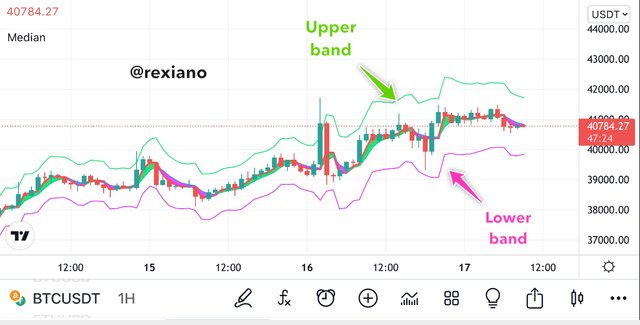
As seen above, that’s how the median indicator appears on the price chart. We can go ahead and make the parameters of this indicator to fit the analysis we want to carry out on the price chart. This will require that we leave the default set up and make something new.
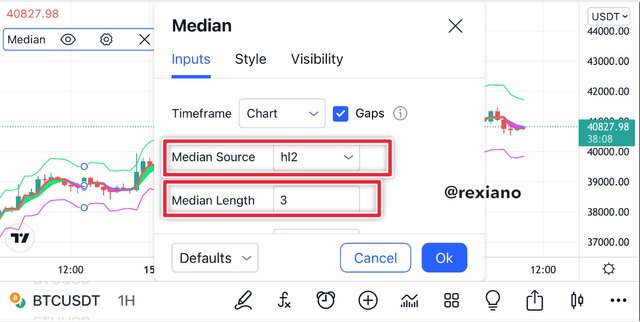
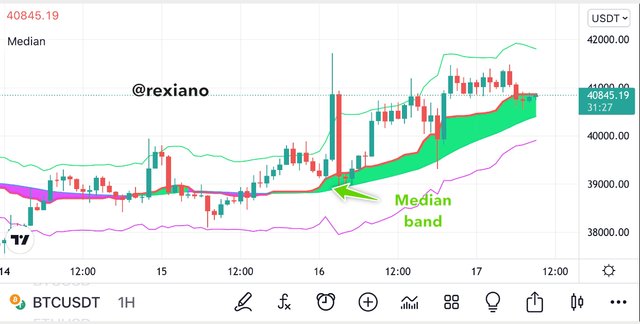
As seen above we have the median indicator settings to change so that it works and delivers the way we want it to. We see that this indicator has an upper band and a lower band. The main object of the keynote is the median line that appears thick on the indicator.
I will change the indicator saource from “hl2” to “close”. I will also change the median length to a higher length so that I can see my candlesticks clearer rather than the complex look of the indicator at a length of 3. Note that we can change the median length for higher lengths to work with longer terms such as that which will give us long term trade signals. For intraday trading we can use smaller lengths to get multiple trading signals. Here I will take the length to 20 and we will see how the chart and the indicator will become clearer for me to see well. Also, I can now get clear signals from the median line color changes from purple to green.
We can see the changes I have made on the settings of the indicator and how it now appears clear for us to see and make entries and exits pretty easily.
Median Source
This is the source from which the median indicator calculations are based
Median Length
This refers to the amount of data points of the source that was used in the calculations of the median indicator. It gives the length to which you want the indicator to operate
ATR Length
This is the parameter that determines the time period used during calculations of the true average range of the indicator
ATR Multiplier
The value that determines the extension between the upper and lower bands.
Just as the statistical median is calculated, so is the median value. With the adjustment of the parameter you get your indicator set to play positive on the chart. These calculations are done by adding the highs and lows then dividing by the number of highs and lows added. In simple terms we add a high and a low and divide by two.
(High + Low)/2 or (Highs + Lows)/n
Where “n” will stand for the number of Highs and Lows added up.
From the beginning I mentioned that the Median indicator is a trend following indicator and can be used to catch significant trend opportunities in the market for the trader to play safe with.
During an uptrend we will see that the median line turns to green with the price chart also moving upward and such moves are always supported with high volume.
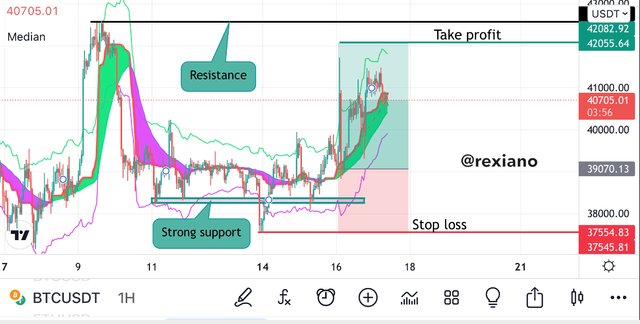
We can see from the above screenshot that the purple median gave way for the green median and the price crossed the median line headed for the upper band. After the price hit the upper band it retraced to the median and bounced back upward while the median line color still stayed green, that’s when I made entry.
The exit criteria of the above long position is down such that the stop loss is placed below an immediate support at an outlier price and the take profit just at the 1:2 risk reward ratio level of the stop loss. We can see above that there’s a resistance formed at the previous high but my take profit is below that point. In case the median line changes to purple at any point in time without my target hit, I will have to close the trade and take profit.
For a downtrend we simply make sure we are working with the purple median line. Whenever the median line turns from green to purple, we make entry by opening a short position but when the median changes back to green, we must close all open sell positions.
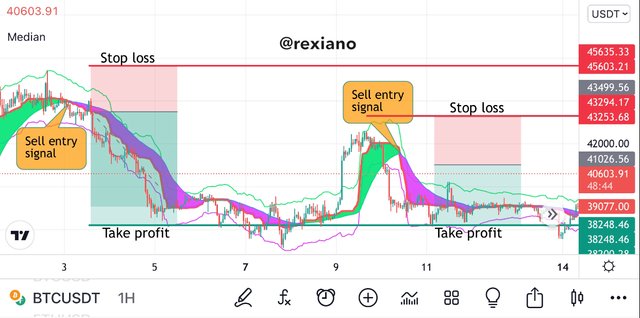
From the above screenshot we can see how I carried out the indicator trade criteria and made two short trades. The first short position on the left side of the screenshot was opened when the price trades and the median changed from green to purple color. I placed the stop loss just above the immediate resistance which is the previous “highest high”. The take profit of this first short position and the second one are the same because I found out that the price has a strong support at that point. We can see on the second trade that the entry is made when the green changed to purple median line and the take profit is set at the strong support level while the stop loss was set just above the previous high.
Indicators are known to be faulty at some points and especially trend following indicators. The Median indicator also has some flaws which amongst them is the fact that it can give false signals some times. Like I mentioned in the other section above, most of the time when the price moves from downtrend to uptrend we should have the volume indicating this by change in color of the volume spikes.
I will use the RSI indicator in confluence with the Median indicator in order to identify and reject false signals as well as filter every signal gotten from the Median indicator before taking it into consideration.
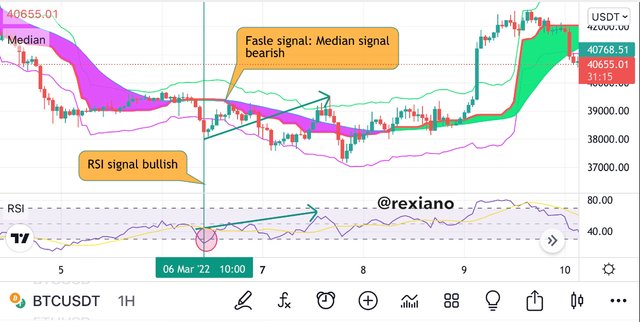
The above screenshot shows a clear false signal from the Median indicator. The chart on the screenshot identifies when the RSI was in the oversold zone indicating a bullish market while the median indicator on the other hand indicated a bearish market. The price from the beginning almost followed the median signals but spiked and hit the upper band and went over it. If a trade was placed in a short position we would’ve gotten rekt by hitting the stop loss. Just after hitting the upper band, the RSI confirms a small possible bear market which is correct. We can see how the median indicator can be faulty sometimes. It’s best to use this indicator together with o non trend following indicator such as the Relative Strength Index (RSI) indicator to avoid complications and trade failures.
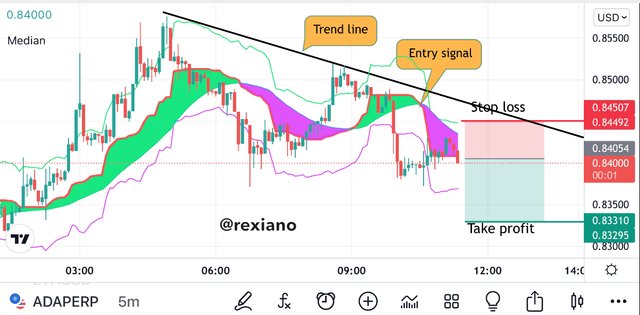
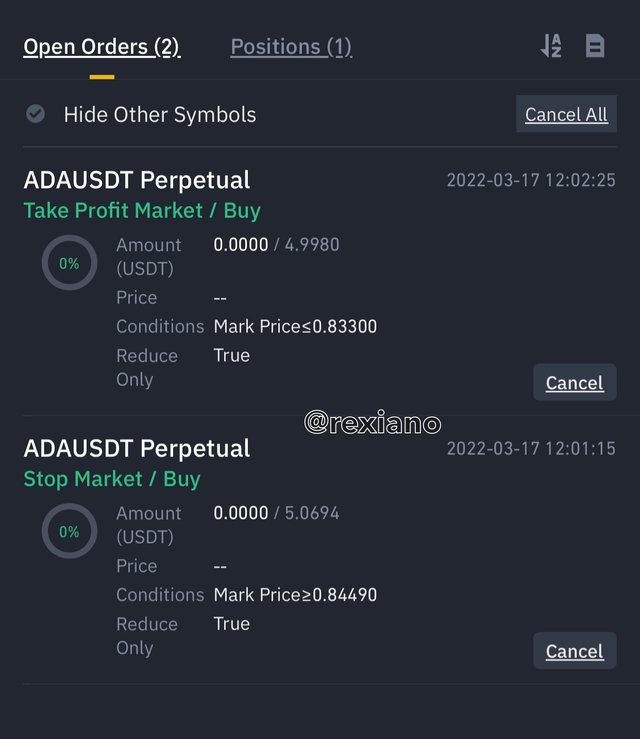
I opened a short position on the DAUSDT pair based on the median indicator analysis together with the trend line in a 5 minute time frame. My trend line says the market is in an overall bear run and the median indicator gave a sell signal. This analysis can be seen clearly on the following screenshot.
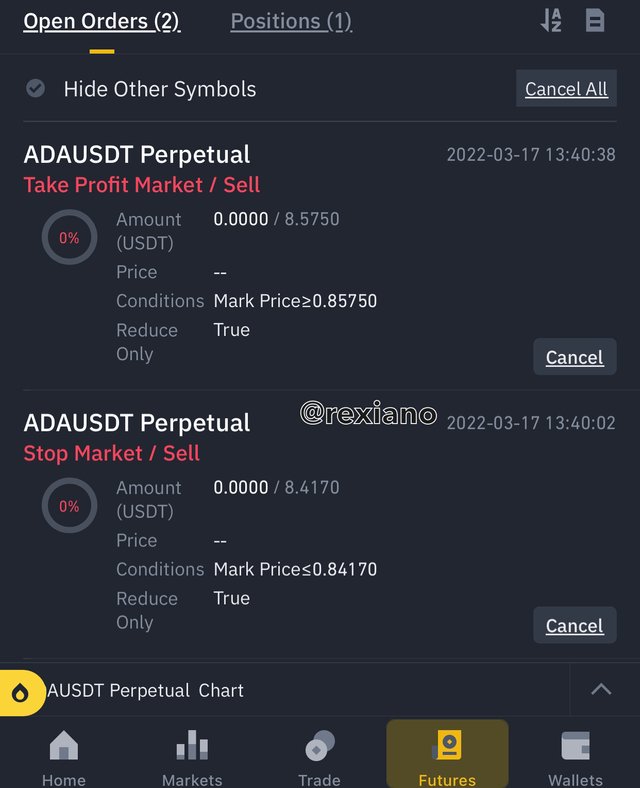
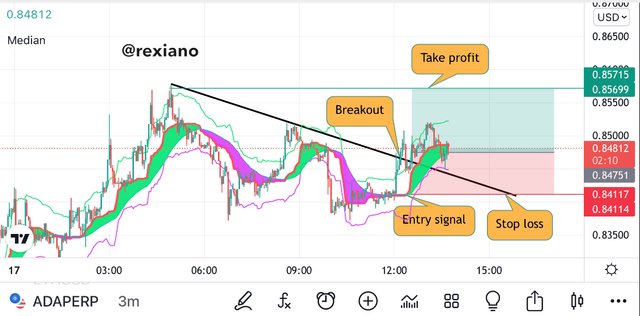
For the long position, I will study any cryptocurrency of my choice and carry out the median indicator analysis and place a buy trade. On this exercise I will still use the ADAUSDT trading pair since the market has turned to the other side. The screenshot for analysis is seen below.
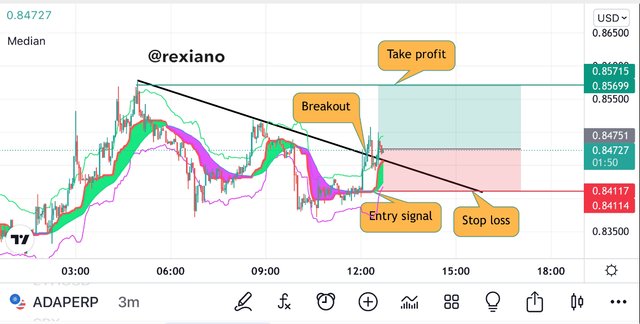
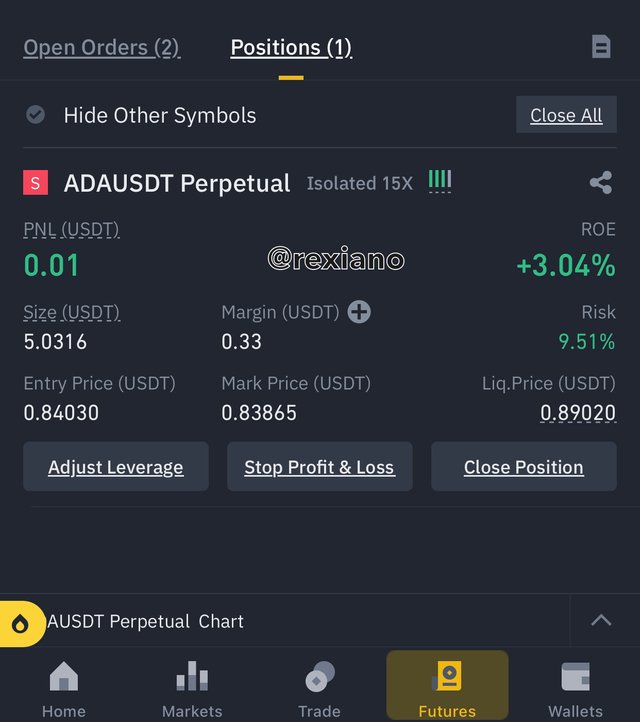
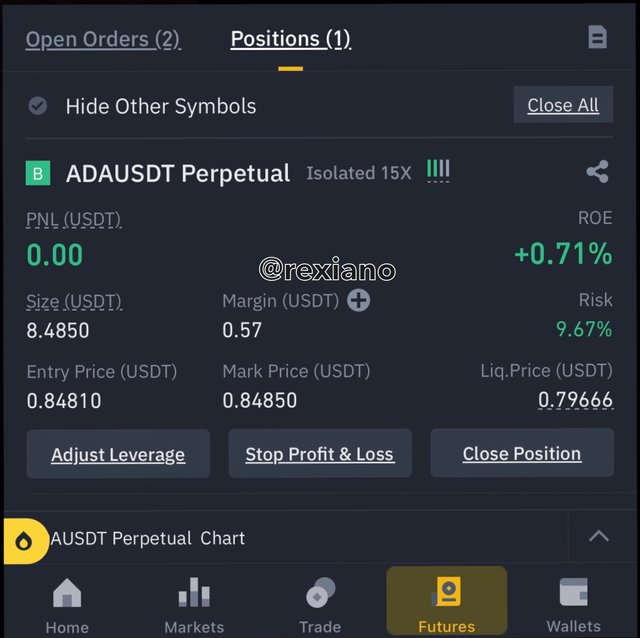
On the above screenshot we can see that after some time the asset trades to halfway my take profit point and retraced only to bounce and head back for the target. Below is the trade progress on Binance.
Indicators as a whole are a vital component of technical analysis in trading cryptocurrency assets. The Median indicator is one of the good trend following indicators used in the trading industry and it has the capacity to function in different time frames and for different market terms such as short term, medium term, and long term trading analysis.
This indicator can be used with other non trend following indicators such as the famous RSI indicator in order to filter possible false signals from the Median indicator. When two or more indicators compliment each other, the signal becomes very valid. The screenshot cut criteria of this strategy (using the median indicator trading criteria) will depend on the trader but generally when the median line changes color, it’s significant to the trader to open positions on a merger direction and close other open positions on the opposite side of the market direction.