Trading Crypto with Keltner Channels - Crypto Academy S5/W6 - Homework Post for Professor @fredquantum.


Hello Steemians, I'm glad to participate in the 6th week of season 5 in the Steemit Crypto Academy. Today's lesson was delivered by professor @fredquantum on Keltner Channels. The crypto space is filled with ups and downs and the highly volatile nature of the market is of great concern to crypto traders. Traders make efforts to utilize the necessary tools needed to profit in the market.
Technical indicators are one of the amazing tools traders utilize for confirmation and trading signals to make trading decisions. Some of the indicators are volatility-based indicators used to measure the price volatility of a crypto asset. This study focuses on one of the volatility-based indicators which are Keltner Channels. Let's get down to understanding this indicator and how we can make trading decisions using the signals from the indicator.
Understanding Keltner Channels
Keltner Channel indicator is one of the volatility-based indicators that measures the volatility in the price movement of a crypto asset. This indicator was first developed by Chester Keltner using a simple moving average but was later modified by Linda Bradford Raschke using the Average true range (ATR).
The indicator is seen on the chart comprising of 3 lines that form the channel. The middle line is the exponential moving average (EMA) which is plotted using 20 periods by default. The upper band and the lower band are plotted above and below the EMA using 2 multipliers of the ATR. This can further be explained below:
Middle line = Exponential moving average(EMA) plotted 20 periods by default.
Upper Band = +2 times Average True Range (ATR) above EMA.
Lower Band = -2 times Average True Range (ATR) below EMA.
The movement of price within the channel serves as a trading signal which can be used to identify trends, breakouts, dynamic support, and resistance and also helps to maintain good risk management. Traders can utilize this information to improve their trading and make good trading decisions.
Setting up Keltner Channels on a Crypto Chart
In this section, I will explain how to set up Keltner Channels on Tradingview. This is done using the following steps below.
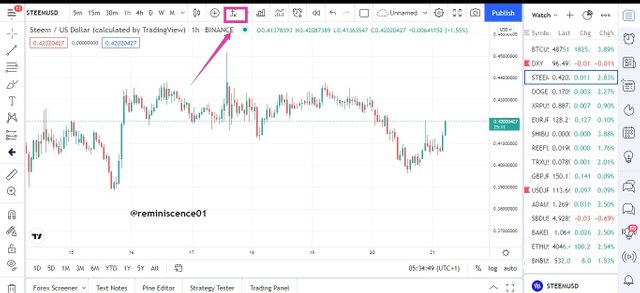
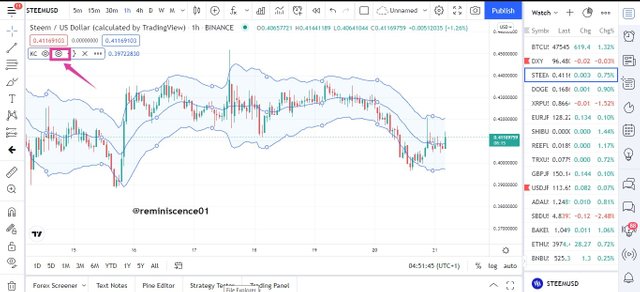
On Tradingview chart homepage, I will click on the indicator icon fx at the top page.
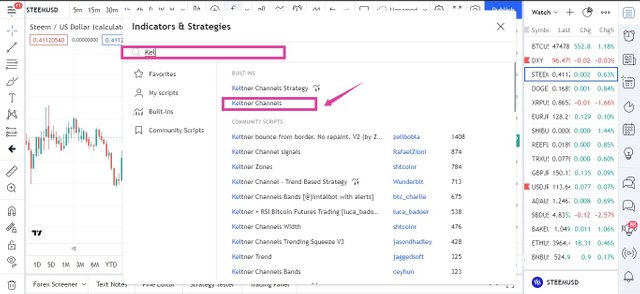
The indicator interface pops up. I will search for Keltner Channels using the search toolbox and then click on it. After that, the indicator is added to the chart. Screenshots of the steps can be seen below.
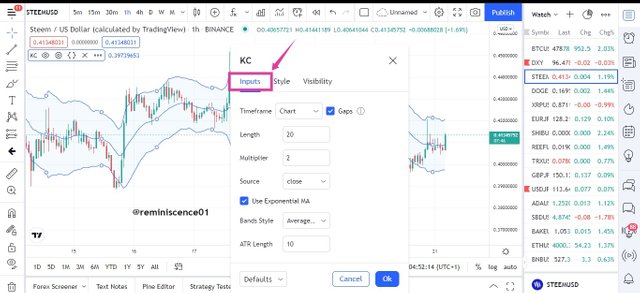
Now that we have added Keltner Channels on the chart, let's look at the settings and how we can modify them to suit our trading style. This is done by clicking the settings icon of the indicator. A screenshot is shown below.
Inputs: The inputs contains the most sensitive parameters of the indicator through which the basis of the calculation is obtained from. Altering these parameters will result in a change in the structure and performance of the indicator. The parameters includes the length, Multiplier, ATR length and also Band style. The settings on the screenshot below are the default settings of the indicator but this can be modified to suit a trader's trading style.
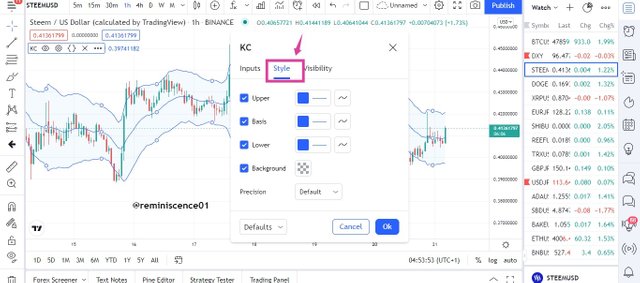
Style: In this section, the appearance of the indicator on the chart can be modified to suit a trader's style. This includes the line colors of the bands and also the background appearance of the indicator. This can be seen in the screenshot below.
Calculation of Keltner Channels
We have explained the different parameters of the Keltner indicator in the previous sections. Now we will be looking at how the indicator is calculated to produce the channels on the chart.
The following parameters are used:
EMA: Exponential moving average plotted over 20 periods.
ATR: Average true range plotted over 10 periods.
Multiplier: This is usually set at 2.
Now,
The middle line: This is gotten by calculating the EMA over 20 periods.
The Upper Band: This is gotten by calculating the ATR over 10 periods and then multiplying it by 2. The result gotten is being added to the EMA.
Upper band = EMA + (2*ATR)
The lower Band: This is gotten by calculating the ATR over 10 periods and then multiplying the result by 2. The result gotten is subtracted from the EMA.
Lower band = EMA - (2*ATR)
The calculations above are the default settings of the indicator. However, a trader can modify this to suit his trading style as parameters directly react to changes in the performance of the indicator on the chart.
Keltner Channels Trend Confirmation
Uptrend
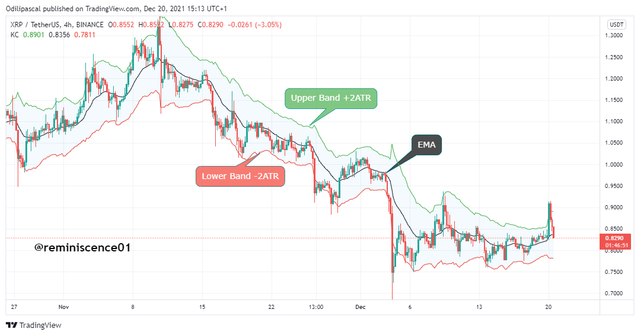
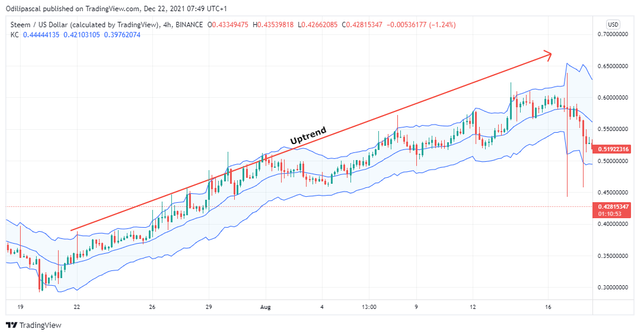
Identifying trends in the market is very important to traders. Trading alongside the trend gives you an edge to take advantage of the market. The Keltner Channels indicators help to identify potential market trends for traders. For an uptrend using Keltner channels, we tend to see the channel in an ascending form. The channel is seen inclining upward with the price hitting the upper band and the EMA line (centerline). An example can be seen on the chart below.
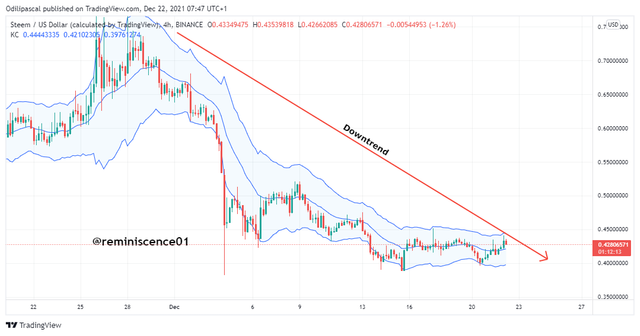
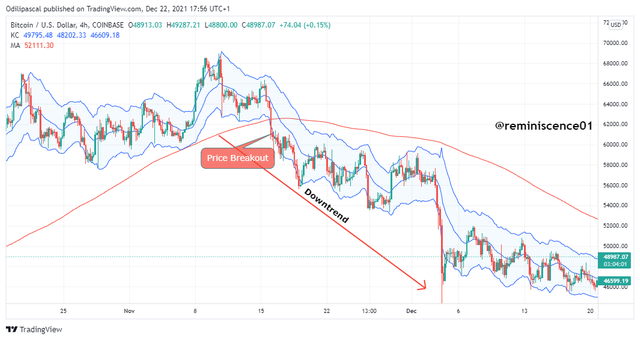
Downtrend
Similarly, in the case of a downtrend using the Keltner Channels indicator, the channel is seen declining forming a movement downward. Also, we will see the price hitting the lower band and trading below the EMA line (centerline). This can also be accompanied by price forming a lower high and a lower low formation indicating a bearish trend in the market. The Keltner channel plays an important in identifying trends and can also help traders to make an entry into the market. An example can be seen on the chart below.
Sideways Market on Keltner Channels
The sideways market often called the ranging market by some traders is the phase of no trend in the market. This phase is considered as an accumulation phase for the beginning of a new trend. During this time, we tend to see prices in a range bouncing off support and resistance levels.
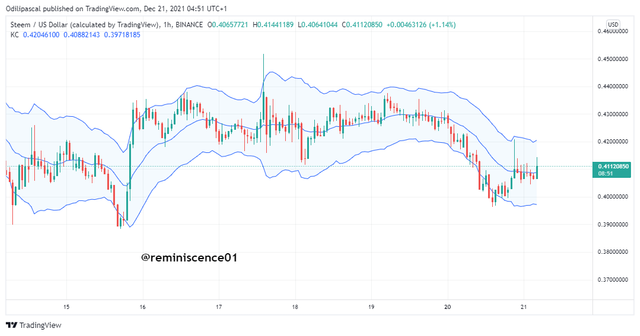
The sideways market can easily be identified using Keltner channels, here we see the channel flat without inclining or declining to any angle. Also, we tend to see the channel contrast with small bodies candlestick. An example of this can be seen on the chart below.
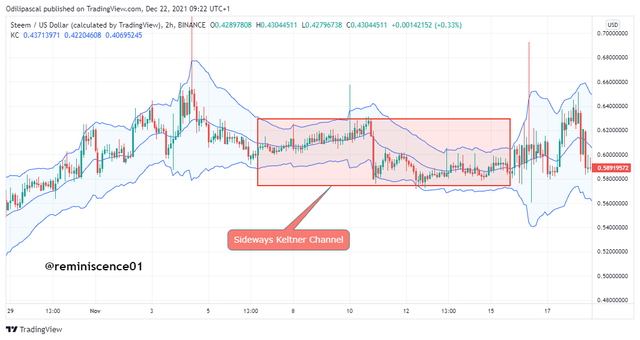
From the chart above, we can see the Keltner channel flat during a sideways market with smaller candlestick bodies. Unlike the uptrend and downtrend, we explained in the previous section where the channel is tilted at an angle.
200 MA with Keltner Channels
It is not advisable to use any indicator as a standalone trading strategy to make an investment decision. The reason is that indicators are prone to generating false signals and might not detect a fake-out when used alone. For this reason, indicators are combined with other indicators or other technical analysis tools to make an investment decision.
In this section, we will be looking at combining the Keltner channels with the 200 MA to enhance the trade signals. The 200MA is a trend following indicator which can help us confirm the trend signal from the Keltner channels.
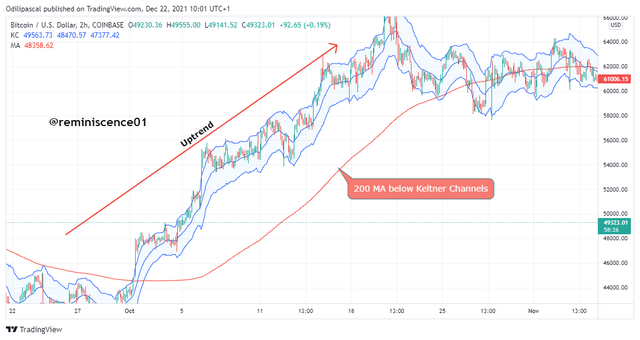
200 MA with Keltner Channels in an Uptrend
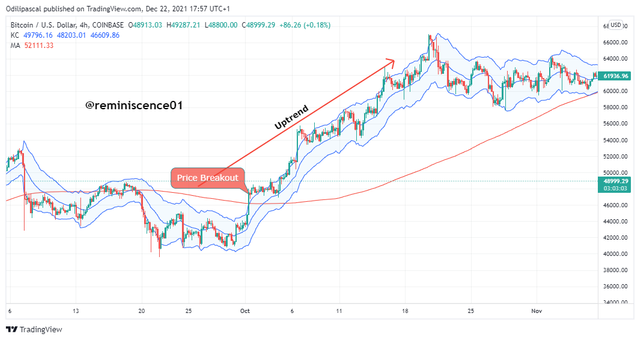
During an uptrend, the Keltner channels are seen inclining at an angle with price forming a higher high formation. This uptrend signal can be further confirmed using the 200MA as it can be seen below the Keltner channel. The appearance of the Keltner channel above the 200MA is a strong bullish trend signal which will be violated if the Keltner Channels break below the 200MA. An example can be seen on the chart below.
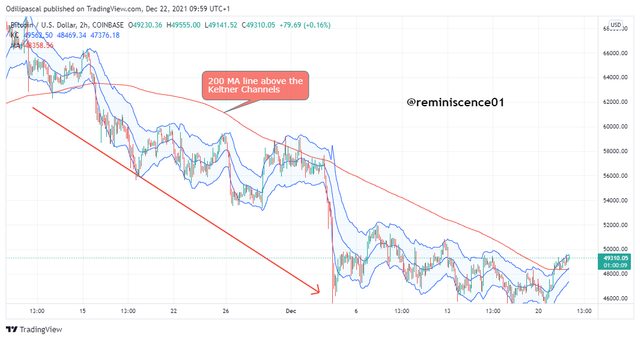
200 MA with Keltner Channels in a Downtrend
Similarly, during a downtrend as explained in the previous section with Keltner channels, we tend to see the channel declining at an angle. This is bearish trend confirmation using the Keltner channels. To further confirm the downturn signal from the Keltner channels, the 200MA can be combined for trend confirmation.
During a downtrend, the 200MA is seen above the Keltner channels which further confirms the bearish signal from the Keltner channels. A break above the 200 MA violates the downtrend and signals a trend reversal signal. An example can be seen on the chart below.
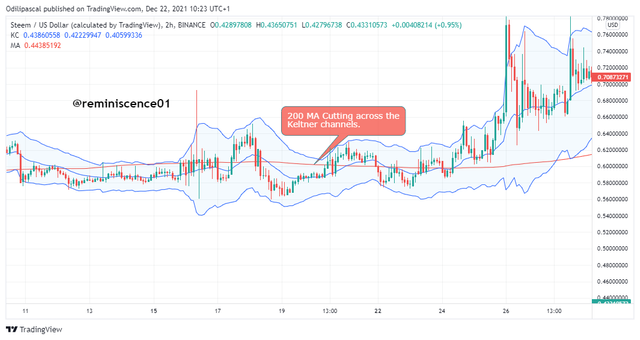
200 MA with Keltner Channels in a Sideways Market
During a sideways market, the Keltner channels are seen to be flat without tilting to any angle. This is a phase of no trend in the market. The 200 MA can be used to confirm a sideways market also when used with Keltner channels. The 200 MA cuts across the Keltner channels during a sideways market. This is a confirmation that the price is neither trending upward nor downward. An example can be seen on the chart below.
In this section, I have explained how we can use the 200 MA in conjunction with Keltner channels to have a good trading signal. The 200 MA serves as a confirmation tool to the Keltner channel to avoid mixed or false signals from the Keltner channels.
Dynamic Support and Resistance with Keltner Channels
The normal psychology of support and resistance is that it appears on a plane surface and is drawn manually using horizontal lines on the charts. Meanwhile, price changes can occur in the future with price finding new support and resistance. The manual support and resistance we draw on the chart do not fit in to adjust to the newfound support.
The dynamic support and resistance enable adjust automatically to price movement as momentum changes in the market. The dynamic support and resistance move alongside price to identify future support and resistance levels. A good example of a dynamic support and resistance tool is the moving average, Bollinger bands, and the Keltner
channels.
Let's look at how we can identify dynamic support and resistance points on Keltner channels.
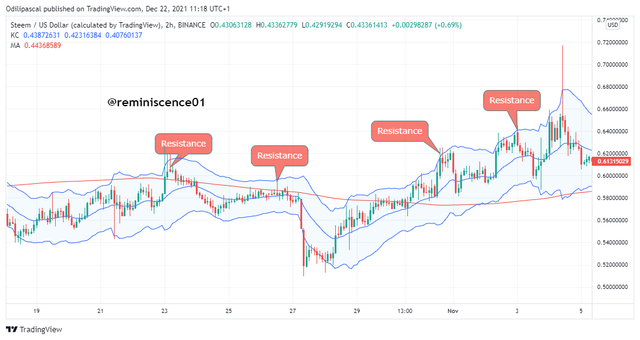
Dynamic Resistance using Keltner Channels
The upper band of the Keltner channels serves as a dynamic resistance area. The Keltner channels changes and adopts recent and future price changes to identify future support and resistance areas. This makes it very easy for traders as they don't have to fill their charts with horizontal lines. An example can be seen on the chart below.
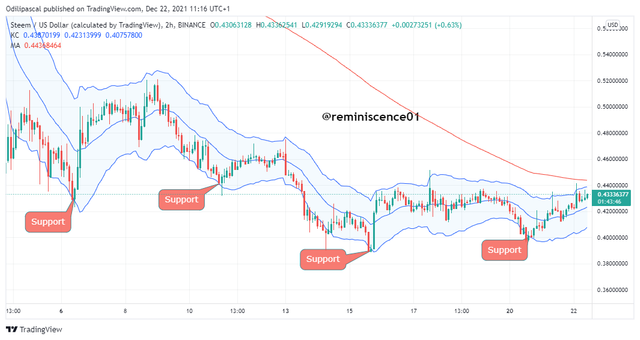
Dynamic Support
The lower band of the Keltner channels serves as a dynamic support. Traders can capitalize on the lower band to find recent and future support areas as the indicator adjust to price changes in the future. An example of dynamic support using Keltner channels can be seen on the chart below.
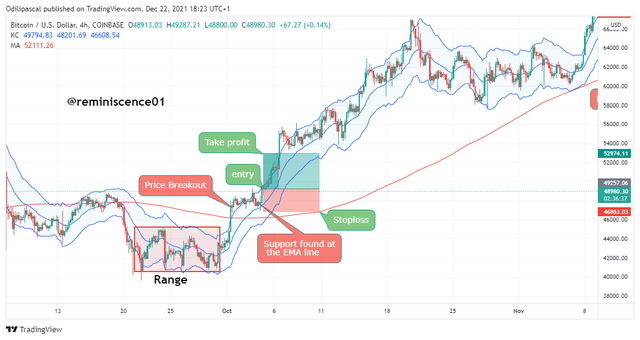
Price Breakouts with Keltner Channels
Breakouts occur in the crypto market after the price has consolidated within a range for some time. We have discussed the ranging market in the previous section where price bounces off support and resistance to gather momentum for a new trend. When this momentum is finally accumulated, the price breaks out to either the upside or the downside.
Keltner channels can be used to identify price breakouts in the crypto market.
The upper band and the lower band serve as dynamic support and resistance levels during the sideways market. Price breakout is seen as the candlesticks breakout and closes above the upper band (resistance). This breakout indicates bullish momentum in the market and the beginning of a new uptrend. Breakout traders can capitalize on this opportunity for an entry position. An example can be seen in the chart below.
Similarly, in the case of a downward breakout using Keltner channels, we tend to see price break below the lower band after the price has consolidated for some time. This shows strong bearish momentum and a beginning of a new downtrend. An example can be seen on the chart below.
Looking at the two examples above, we can also see how the 200MA is used to confirm the breakout and also confirms the new trend. This is as the Keltner channels cross above and below the 200 MA.
Rules for Trading Breakouts with Keltner Channels
Every trading strategy has its own rules for good trading success. Every trader needs to obey these rules to have an effective result using the strategy. In this section, we will be explaining the rules for trading breakouts using Keltner channels.
Rules for a Bullish Trade Breakout
Wait for the price to breakout above the upper band (resistance) after a ranging market. Ensure that the breakout candle closes above the upper band.
Wait for price to retrace back and find support at the middle line and within the upper band. After the price has found support at the middle line (EMA) and trading within the upper band, an entry position can be taken after 2 or 3 bullish candlestick confirmations.
Risk management for this trade can be a 1:1 risk-reward with a stop loss placed below the middle line (EMA support). An example can be seen below.
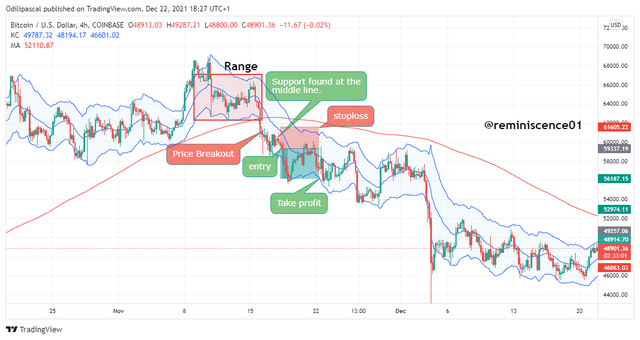
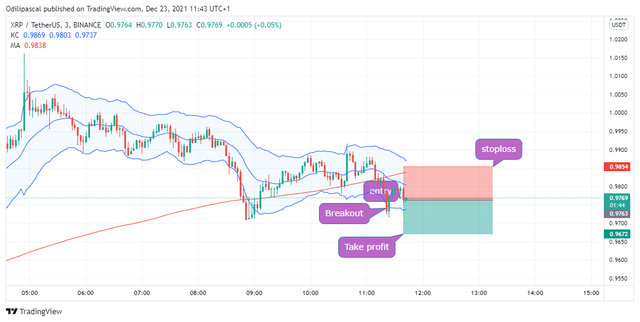
Rules for Bearish Breakout on Keltner Channels
Wait for the price to breakout below the lower band (support ) after a ranging market. Ensure that the breakout candle closes below the lower band.
Wait for the price to retrace back and find resistance at the middle line and within the lower band. After the price has found resistance at the middle line (EMA) and trading within the lower band, an entry position can be taken after 2 or 3 bearish candlestick confirmations.
Risk management for this trade can be a 1:1 risk-reward with stop-loss placed above the middle line (EMA resistance). An example can be seen below.
Keltner Channels Vs Bollinger Bands
The Bollinger band and the Keltner channels are almost similar in the sense that both technical indicators are volatility-based and offer almost the same signal to traders. There's a slight difference in both indicators which includes the following :
The upper bands and lower bands of the Keltner channel are calculated using the average true range (ATR) while that of Bollinger bands is calculated using a standard deviation of price data points. This difference seen in the calculation might also affect how price reacts on the indicators and also the signals obtained from the indicators.
Due to the ATR used in the Keltner channel, it tends to react faster to price fluctuations compared to Bollinger bands which react slower. The Bollinger band generates a smoother line which cancels out noise in the market and reacts to recent price changes.
The standard deviation used in Bollinger bands gives a wider range between the upper band and the lower band. Whereas the Keltner channels give a tighter channel between the upper band and the lower band. This can give mixed-signal information to a trader like fake breakouts and false trend confirmation.
Selecting between both volatility-based indicators depends on the trader's trading style and information he wishes to extract from the market.
Crypto Trades Using Breakouts with Keltner Channels
In this section, I will carry out a trade analysis/order using Breakouts with Keltner Channels on the Tradingview platform. The trade will be executed using Tradingview paper trading.
Here, I will give a general setup of the breakout strategy utilized in taking the 4 trades in this section. These trades were carried out using the breakout strategy rules explained in the lesson.
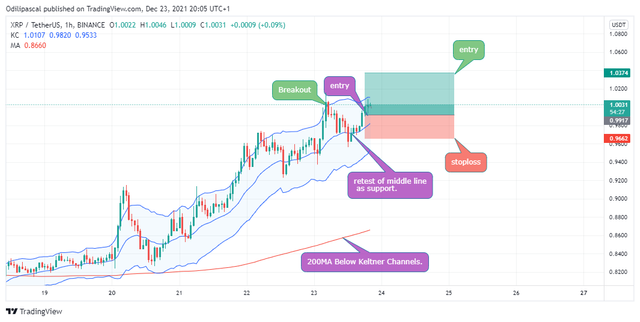
On opening the chart, I look at the position of the 200 MA moving average to determine the market direction.
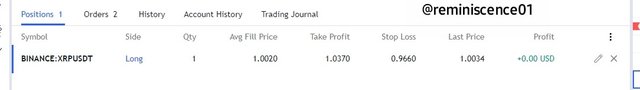
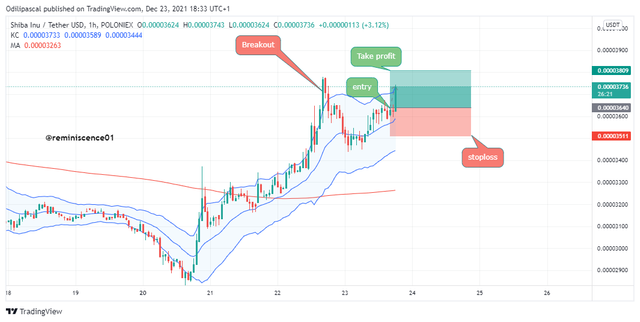
For the Buy Trade Setups, I noticed that the 200MA is below the Keltner channels which indicates that the trend is bullish. Now looking at the Keltner channels, price broke out of the upper band signaling a bullish momentum in the market. After that, the price came back down and found support on the middle line (EMA) before reversing back up. I opened a buy position after two bullish candlesticks with a stoploss placed below the middle line. Details of the trade can be seen in the screenshot below.
XRP/USDT
SHIB/USDT
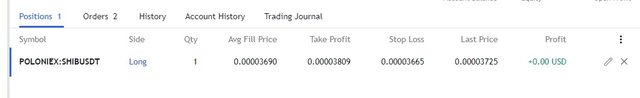
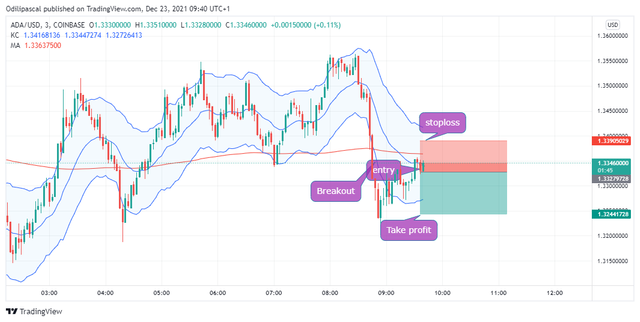
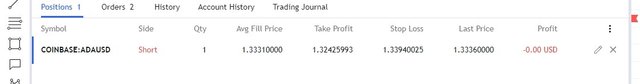
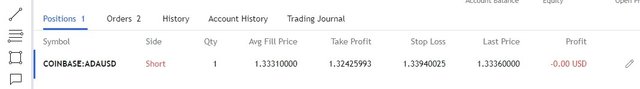
For a Sell Trade Setups, I noticed the 200 MA above Keltner channels which indicates that the trend is bearish. Now looking at the Keltner channels, price broke out of the lower band signaling a bearish momentum in the market. After that, price came back up and found resistance on the middle line (EMA) before reversing back down. I opened a sell position after the formation of 2 bearish candlesticks with stoploss placed above the middle line (EMA support). Details of the trades can be seen below.
ADA/USD Sell Trade
XRP/USDT Sell Trade
Advantages and Disadvantages of Keltner Channels
Advantages
Keltner Channels is very easy to understand and can fit into any trading style.
Keltner channels serve as a good trend indicator to traders. Understanding the direction of the market is very easy and can be spotted at a glance on the chart using Keltner Channels.
Keltner Channels can be utilized by traders to identify breakouts in the market. Similarly, traders can capitalize on
Keltner channels breakout while maintaining proper trade management using the trading rules.The indicator also serves as a dynamic support and resistance area which helps traders to capitalize on the market especially during ranging markets when prices bounce off support and resistance areas.
Disadvantages of Keltner Channels
Keltner channel is prone to generating false signals as the indicator reacts faster to price fluctuations.
The indicator cannot be used as a standalone trading strategy to make a good trading decision. An additional tool like 200 MA is used as a confirmation tool for the signal from Keltner channels.
The indicator sometimes lags behind the current price. This makes it difficult for traders to spot market information on time and thus jump into the market at a higher price. This increases the risk-reward ratio to be obtained from a trade setup.
Conclusion
In this study, we have explained Keltner Channels as one of the volatility-based indicators traders can use to make a good trading decision. The indicator offers exciting trading signals to traders which includes trend identification, breakouts, dynamic support, and resistance areas. The signal from the Keltner indicator can be strengthened or enhanced when it is combined with other tools like the 200 MA.
Unlike other volatility-based indicators like the Bollinger band. Both indicators are classified as channels but differ in the parameters utilized in their calculation. This affects the reaction of the indicators to the current market price. It is left for a trader to select the channel that best suits their trading style while still maintaining proper trade management.
Thank you professor @fredquantum for this amazing lesson.