High Profitable Trading with VuManchu Cipher B Indicator - Steemit Crypto Academy s5/w6 - Homework Post for professor @reddileep.


Hello Steemians, welcome to another great week in the Steemit Crypto Academy. This week's lesson is delivered by professor @reddileep on a crypto trading strategy with the VuManchu Cipher B indicator. Indicators are important technical analysis tools available to assist traders to make good trading decisions in the market. In this study, I will answer the questions given at the end of the lesson to understand the trading strategy using the Fu Manchu Cipher B indicator.
Understanding VuManchu Cipher B Indicator
VuManchu Cipher B is one of the technical indicators available to crypto traders to make a good trading decision. This indicator is unique compared to other technical indicators as the indicator comprises several indicators coupled in one. Traders can take advantage of the useful signals from the VuManchu Cipher B indicator to predict and forecast future market prices and also determine buy and sell signals in the market.
VuManchu Cipher B is a combined indicator comprising of the relative strength index (RSI), the money flow indicator, Market volume, and momentum, etc. With these, traders can also get information on money flow in and out of the market. The indicator might seem to be complex at default settings, but a trader can modify it simply to get useful trading signals from the indicator.
The basic principle of the VuManchu Cipher B discussed in the lesson comprises a wave line that indicates the inflow and outflow of money in the market. Traders can utilize this signal to ascertain the momentum in the market. Also, the wave formation comprises of a Dot signal which changes from green to red as the market direction is shifted from bullish to bearish.
Customizing the VuManchu Cipher B Indicator
In this section, I will be explaining how to add and customize the VuManchu Cipher B indicator. This study will be carried out on Tradingview platform.
Adding VuManchu Cipher B on the chart
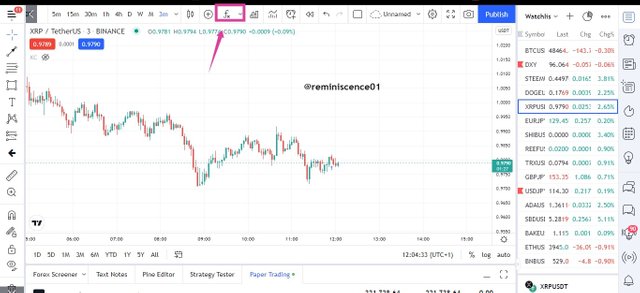
Access Tradingview.com official page and click on Chart to access the chart interface.
On the chart interface, click on the indicator icon Fx located at the top center of the chart page.
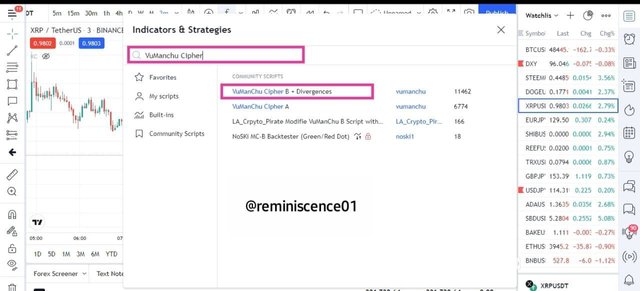
The indicator library landing page pops up. To easily identify our preferred indicator, we can use the search box and type in VuManchu Cipher B.
The indicator list is sorted out, click on VuManchu Cipher B + Divergences to be added to the chart. This is further illustrated in the screenshots below.
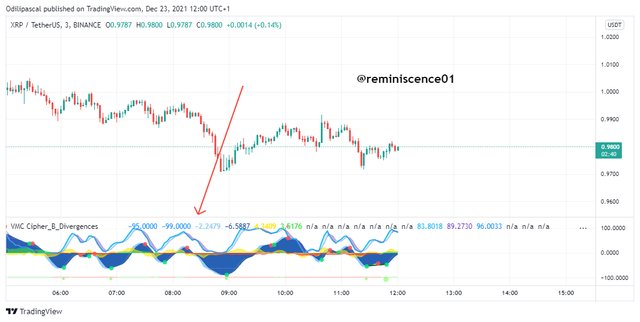
From the chart above, we have successfully added the VuManchu Cipher B indicator to the chart. Now let's look at how we can customize the indicator to our requirements.
Customizing VuManchu Cipher B indicator
In this section, we will be customizing the VuManchu Cipher B indicator to suit the trading strategy for this study. This is as follows.
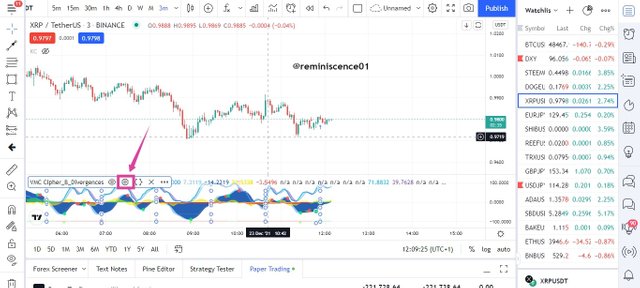
On the added indicator, click on the settings icon located at the top left corner of the indicator window. The indicator parameters pop which and we will be eliminating the indicators that are not needed in this trading strategy.
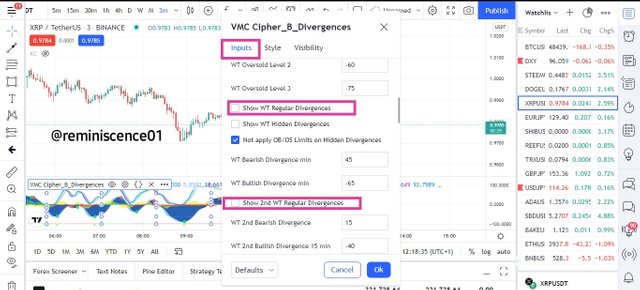
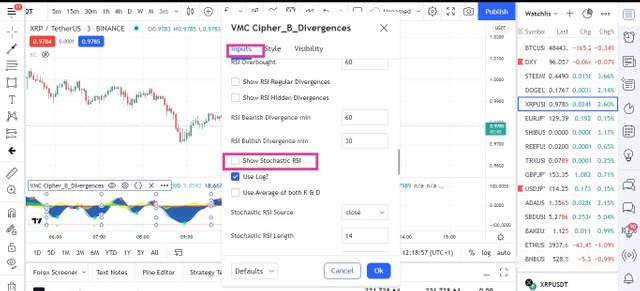
On the input interface, we will untick the following indicators are they are not required for this trading strategy. They include WT Regular Divergences, 2nd WT Regular Divergences, and Stochastic RSI. We can remove these by unticking the box as shown in the screenshot below.
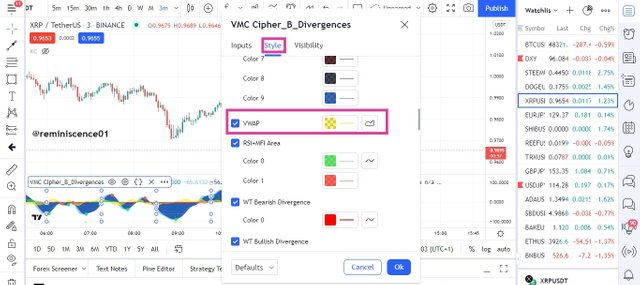
After customizing the inputs and eliminating the unnecessary indicators, we will switch over to the style interface to customize the appearance of the indicator on the chart. This can be done by clicking on style.
In this section, we will be eliminating the VWAP which stands for volume-weighted average price indicator. This indicator is found to be irrelevant to our trading strategy.
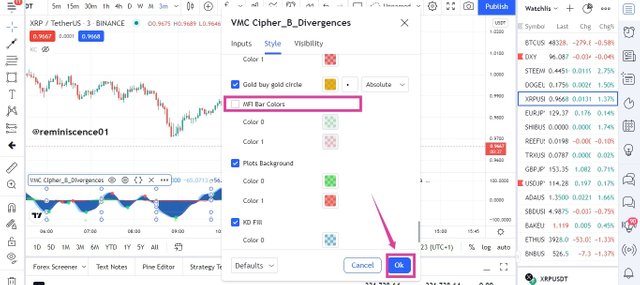
Another irrelevant indicator to be removed is the "MFI Bar Color" indicator. This represents the money flow index colors bar shown below the indicator window. After that, click Ok to save the customized settings.
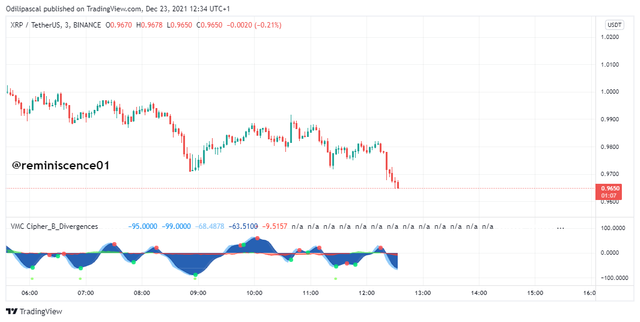
From the chart above, we can see that we have a clearer and clean indicator window compared to the default indicator window.
Explaining the appearance of the VuManchu Cipher Indicator on the Chart
In the previous sections, we have explained how to add and modify VuManchu Cipher B on the chart. Now we have a clean chart to generate trading information from the indicator. Let's look at the signal information we can obtain from the indicator with the current configuration.
The first indicator we have is the Wave Trend indicator which occupies the major space in the indicator window. The wave trend indicator is made up of two blue lines that oscillate above and below a zero line. This line includes the light blue line and the dark blue line.
The crossing of the two lines is an indication of a change in market trend and also an indication of the side of market-dominating price (buyers or sellers). Also, the crossing of this line is accompanied by a red and green dot. The appearance of a red dot indicates bearish momentum in the market while the appearance of the green dot indicates bullish momentum.
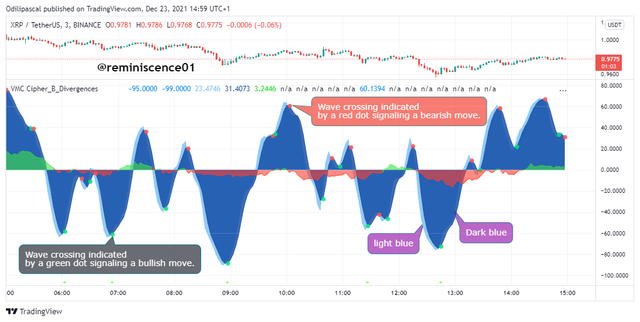
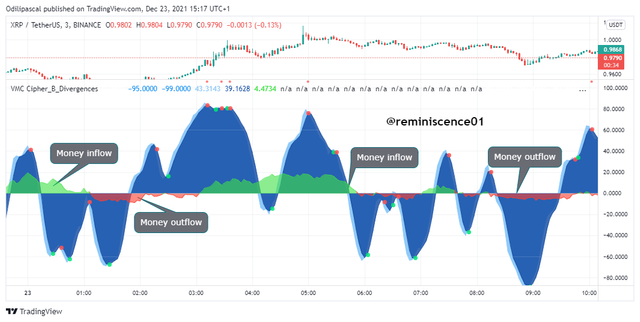
Another indicator on the VuManchu Cipher B indicator is the Money flow indicator which appears like green and red cloud above and below the zero line. The appearance of a green cloud above the zero line indicates money inflow on an asset which signals bullish momentum.
Also, the appearance of the red cloud below the zero line signal money outflow on an asset which indicates loss of momentum in the price of an asset. This information is important for a trader to make good trading decisions in the market. An example of a money flow indicator can be seen in the chart below.
Combining VuManchu Cipher B Trading strategy with Other indicators
Technical indicators are not meant to be standalone trading strategies as these indicators are prone to generating false signals and not being able to detect fakeouts in the market. For this reason, indicators are meant combined with other technical analysis tools or indicators to obtain a true signal.
In the trading strategy explained in the lesson, 2 **Exponential moving average is combined with VuManchu Cipher B to make better trading decisions and also to confirm the trading signals from the indicator.
55 EMA and 200 EMA are used together for this purpose. The crossing of the two EMA's is a strong trading signal and a shift from a bullish to a bearish trend. When the 55 EMA crosses above the 200 EMA, it indicates a bullish movement and dominance of buyers over the sellers in the market.
Also, when the 55 EMA crosses below the 200 EMA, it indicates a bearish movement and dominance of sellers over buyers in the market.
The crossing of the two EMA's combined with the signal from the VuManchu Cipher B indicator gives a strong trading signal to traders. After the crossing of the EMA, the signal is further confirmed on the VuManchu Cipher B indicator before taking any trade positions. This can guarantee a safe trading journey and also help to filter out false signals. An example of the combination can be seen on the chart below.
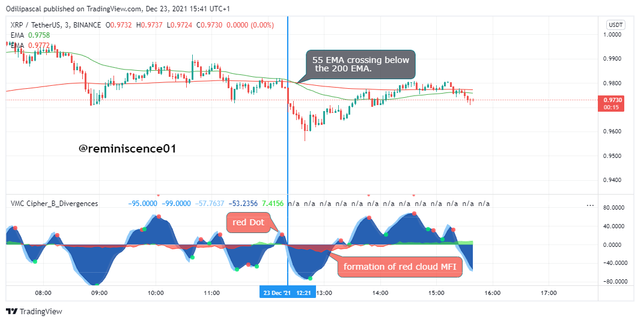
From the chart above, we can see the EMA crossing is in confluence with the VuManchu Cipher B indicator. The crossing of the 55 EMA below the 200 EMA signals a bearish move which can also be confirmed on the VuManchu Cipher B indicator. From the indicator, we can see the appearance of a red dot during the crossing of the light blue wave below the dark blue wave. Similarly, we can also see the appearance of the red cloud which indicates money outflow in the price of XRP. All this put together confirms the sell setup on XRP/USDT.
How to use VuManchu Cipher B Indicator for Successful Trading
We have explained the different signals from the VuManchu Cipher B indicator and also how we can combine it with 55 and 200 EMA for a good trade signal. In this section, we will be looking at how to use the VuManchu Cipher B indicator for successful trading. We will explain this for both the buy signal and sell signal.
Buy Trade Opportunity using VuManchu Cipher B indicator
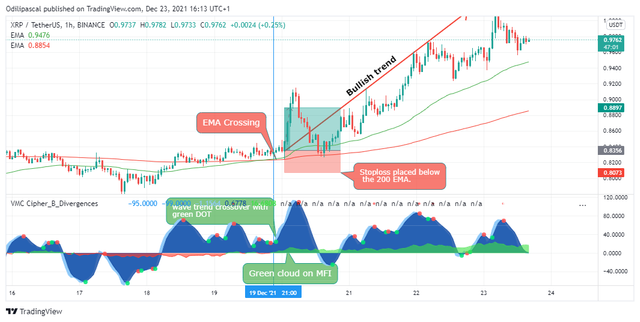
Before considering a buy trade using the VuManchu Cipher B indicator, the 55 EMA must cross over the 200 EMA to ensure that the direction of the price is bullish. After that, we lookout for the bullish signals on VuManchu Cipher B Wave trend indicator and MFI indicator. For the Wave trend indicator, a crossing of the light blue wave and the dark blue wave should be indicated with a green dot.
This shows buyers are in control of the price at the moment. Also, from the MFI indicator, the cloud should be green indicating there's an inflow of money in the crypto asset.
After these bullish trend signals have been seen on the indicator and also the EMA, a bullish position can be triggered with a good risk-reward of 1:1. Stoploss can be placed below the 200 EMA. An example is shown below.
Sell Trade Opportunity Using VuManchu Cipher B Indicator
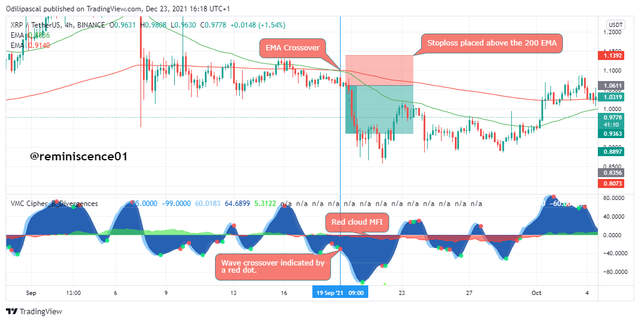
Before considering a sell trade using the VuManchu Cipher B indicator, the 55EMA must cross over below the 200 EMA to ensure that prices have moved from bullish to bearish. After that, we lookout for a bearish signal on VuManchu Cipher B Wave trend indicator and MFI indicator.
For the Wave trend indicator, a crossing of the light blue wave and the dark blue wave will be accompanied by a red dot which shows that the seller has taken over the price of the asset. Also, the MFI cloud should be red indicating money outflow in the price of the asset.
When all these indicators are in confluence with the sell signal, a sell trade position can be opened using proper risk management. I will recommend a 1:1 risk-reward ratio with stop-loss placed above the 200 EMA. An example can be seen on the chart below.
Carrying out a Technical analysis on a Crypto Asset and Opening a trade order using VuManchu Cipher B and other Trading tools
In this section, I will carry out my analysis on Tradingview platform and execute my trade order on the Binance Verified exchange account.
BTC/USD Buy Trade Opportunity on 15mins Chart
Opening BTC/USD, I noticed the price created support at $48244 before reversing to the upside. After the rejection at the support level, went back up to break and retest the trendline. Similarly, we can also see that the 55 EMA have crossed over the 200 EMA signaling a bullish movement in BTC.
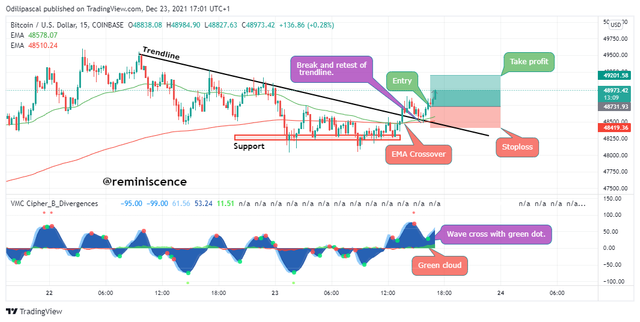
From what we have established, the bullish signal in BTC has been confirmed using 3 confluences. The rejection at support, the break, and retest of trendline and the EMA crossover. After that, I went down to the VuManchu indicator to confirm the bullish signals in BTC/USD.
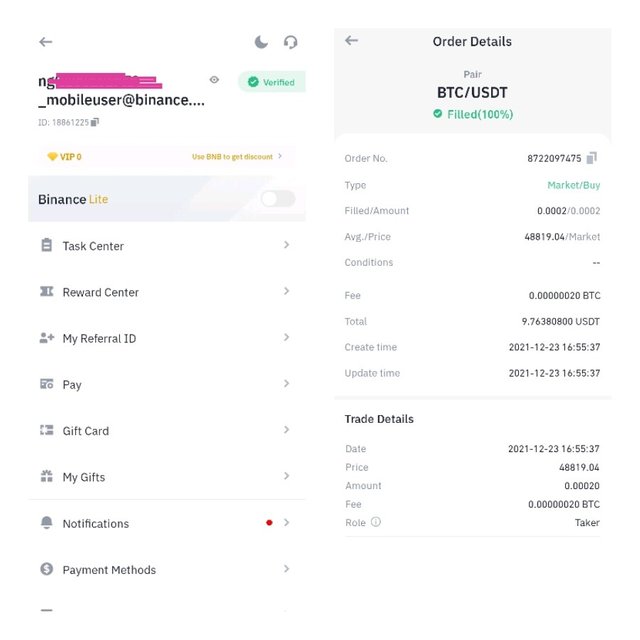
Looking at the indicator chart, I noticed the wave trend crossing with a green dot which signifies that buyers are in control of the market. Furthermore, the MFI indicator cloud is green also signifying the inflow of money in BTC/USD. All these signals put together gave me the confidence to execute a buy order on BTC/USD on my verified Binance exchange account. Details of trade execution can be seen in the screenshot below.
Proper trade management was utilized on the buy order with a stop loss placed below the 200 EMA on a 1:1.5 risk-reward ratio. This can be seen on the chart above.
Conclusion
In this post, we have introduced the VuManchu Cipher B indicator and its trading strategy as explained by professor @reddileep in the lesson. The indicator is essential and unique as it has many other indicators merged in one. The wave trend indicator and the money flow indicator give detailed information on the side in control of the market and also the inflow and outflow of money in the price of an asset.
The indicators' signals can be enhanced when combined with 55 and 200 EMA. However, proper trade management should be used with this strategy with a 1:1 or 1:1.5 risk-reward ratio and stop loss placed below the 200 EMA.
Note: All Unsourced images used in this post are screenshots taken from Tradingview platform and Binance exchange.
Thank you professor @reddileep for this amazing trading strategy.