Fibonacci Tools - Steemit Crypto Academy |S6W4| - Homework Post for Professor @pelon53

Hello Steemians, welcome to the 4th week of season 6 in the Steemit Crypto Academy. The lesson today was delivered by professor @pelon53 on Fibonacci tools. Fibonacci tools are great technical analysis tools for identifying the extent to which price can reach before reversal. In this study, I will be submitting my homework task given at the end of the lesson.

Understanding Fibonacci Retracement
During a trending market, price doesn't move in a straight line. There are dips in form of pullbacks or retracements before price can continue in its original direction. These retracements occur as a result of profit-taking and also an opportunity to open a position in the direction of the trend at a lower price.
During this retracement, a trader does not know how far price can retrace to look for an entry. Also, traders who counter-trend need to know how far price can retrace to set a profit target for their position. The Fibonacci retracement is a technical analysis tool drawn on the chart to identify key levels of support and resistance. The Fibonacci retracement is made up of horizontal levels which serve as support and resistance for price reversals.
This tool is inspired by the sequence of mathematical principles of the golden ratio. Where each number is estimated to be 1.618 greater than the preceding number.
The Fibonacci retracement tool is drawn the recent highs and recent lows of which represent the 0% and 100% on the Fibonacci tools. Other levels on the fibs tools serve as support and resistance levels where price is likely to reverse during a retracement. Here, traders can find entry positions, exit positions, and as well take profit positions for counter-trend traders.
An example of the Fibonacci retracement tool is shown on the chart below.
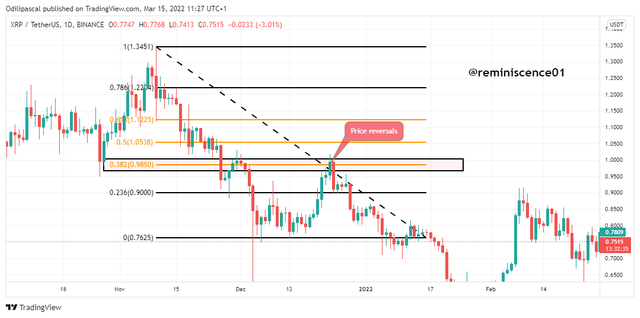
From the chart above, I have used the Fibonacci retracement tool to identify a reversal point after retracement during a downtrend. The Fibs tool was drawn from the recent high to the recent low of price. We can see that price found resistance at the 0.382 levels which is a key level on the Fibonacci sequence.
Fibonacci Extension
The Fibonacci extension is another great tool that can be used in conjunction with the Fibonacci retracement tool. After we have identified the reversal point on the Fibonacci retracement level, price reverses back to the original trend as this area serves as an entry point. The Fibonacci extension tool is now used to determine how far price can travel before another pullback. Traders utilize the Fibonacci extension tool as a profit target point for their positions.
Just like the Fibonacci retracement levels, the Fibonacci extension levels also have levels on the Fibs ratios which serve as support and resistance levels on the chart. These levels serve as a profit target to traders as it reveals the possible distance price can travel after a retracement.
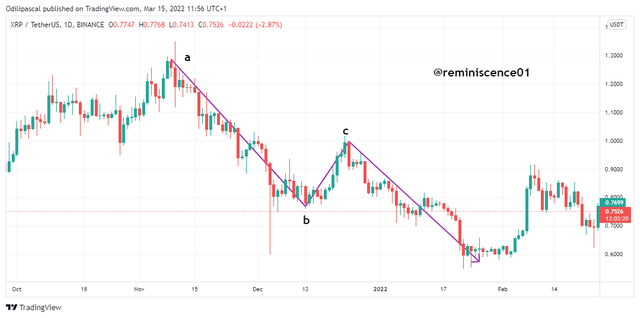
The chart above shows how to plot the Fibs extension tool. To use the Fibonacci extension tool, we need to identify the start of the trend which can be marked as (a), the end of the trend marked as (b), and finally the end of the pullback marked as (c). After that, the Fibonacci extension tool now displays the Fibs levels where price is likely to reach before a pullback. Let's look at the example on the chart below.
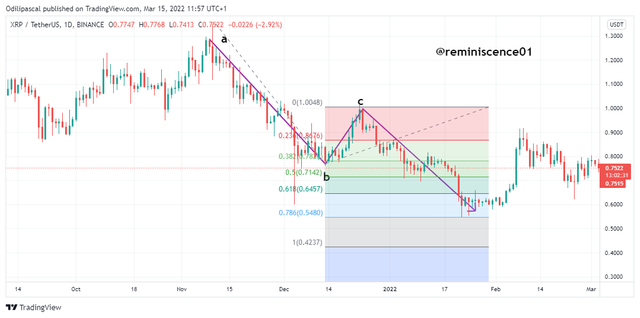
From the chart above, after price has retraced and found support on the Fibs retracement level shown in the previous section, price reversed back to its original direction of the downtrend. Here, the Fibonacci extension tool is utilized to determine how far price will travel before the next pullback. From the chart, we can see that price was extended on the 0.786 Fibonacci extension level before a retracement. This level can serve as a take-profit position for a sell trade.
Understand that all the levels on the Fibonacci tools are key levels and price can find support or resistance on any of the levels. A trader needs to be alerted when price approaches these levels and look out for candlestick reversal patterns before taking a trade.
How to Calculate Fibonacci Retracement
The Fibonacci retracement tool is drawn from the recent highs and recent low of price movement. This high and low point of price is utilized in calculating Fibonacci retracement. The formula for calculating Fibonacci retracement is as follows:
RX = X + [(1 - % Retrace1 / 100) * (Y-X)]
Where,
- X = This represents the previous price where the Fibonacci retracement tool begins. Probably the beginning of a trend.
- Y = This represents the maximum price reached before pullback.
Now we have the rectracement levels given below.
% Retrace 1 = 23.6%
% Retrace 2 = 38.2%
% Retrace 3 = 50%
% Retrace 4 = 61.8%
% Retrace 5 = 78.6%
Let's calculate the Fibonacci retracement for levels 0.618 and 0.236 on XRP/USD chart.
For 0.618 Fibonacci Level
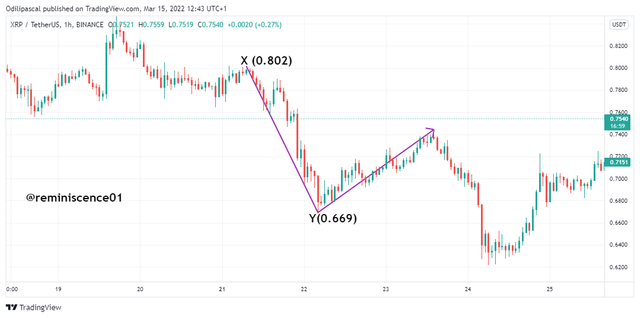
Using the previous formula explained above, we have :
RX = X + [(1 - 0.618) * (Y-X)]
X = 0.802USDT, Y = 0.669USDT
RX = 0.802 + [(1-0.618) * (0.669-0.802)]
RX = 0.802 + (0.382 *(-0.133)
RX = 0.802+(-0.0050)
RX = 0.802 - 0.0050
RX = 0.751 USDT
This can be seen on tbe chart below.
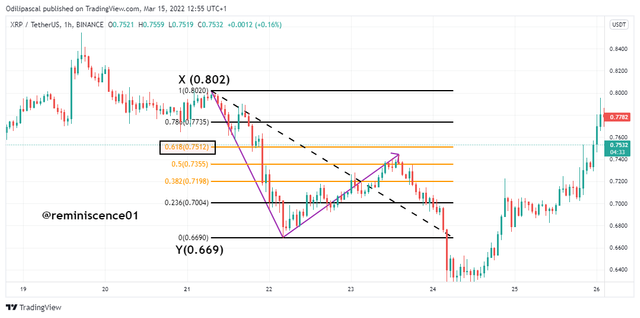
For 0.236 Fibonacci Retracement level
RX = X + [(1 - 0.236) * (Y-X)]
X = 0.802USDT, Y = 0.669USDT
RX = 0.802 + [(1-0.236) * (0.669-0.802)]
RX = 0.802 + [(0.764) * (-0.133)]
RX = 0.802 +(-0.1016)
R = 0.700USDT
This can be seen on the chart below.
From the calculation made above, we can see that the Fibonacci retracement levels of 0.618 and 0.236 correspond with the price obtained from the calculation.
Trading Cryptocurrency on a live account using Fibonacci Retracement
In this section, I will carry out a real trade using trading signals from the Fibonacci retracement tool. The trade analysis will be carried out on Tradingview.com while the trade will be executed on Binance exchange.
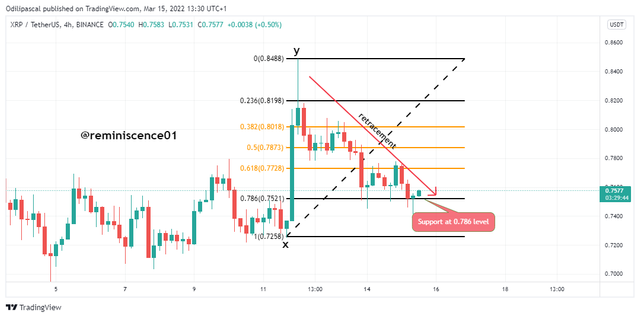
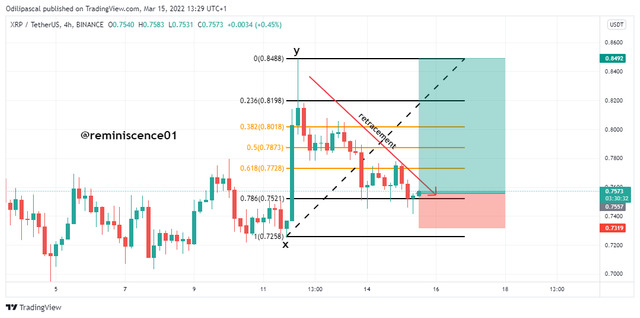
XRP/USDT Buy Trade
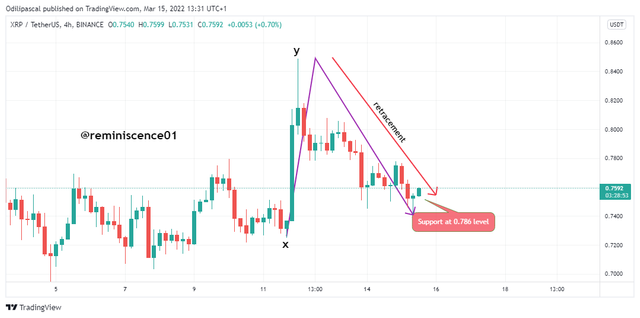
From the chart above, we can see that the bullish movement started at the low point at $0.72. After that, price created a high point at $0.8489 before making a retracement move down. Plotting the Fibonacci retracement tool from the low point at $0.7258 to the high point at $0.84 8 to identify the possible support level price can likely reverse, I noticed that price found support at the 0.786 of the Fibs at price $0.752. This is shown below.
From the chart above, we can see price found support at the Fibonacci level of 0.786. We can also notice a bullish hammer which is a bullish reversal candlestick pattern. I opened a buy position after the formation of the hammer with stoploss placed below the support level (0.786 level). Take profit for this position is placed at the previous as price is likely to retest this level.
The details of the transaction os shown below.
Opening a Demo Trade Using Fibonacci Extension Tool
In this section, I will carry out a Demo trade using trading signals from the Fibonacci extension tool. The trade analysis will be carried out on Tradingview.com while the trade will be executed on Tradingview Paper trading.
BTC/USDT Buy Trade
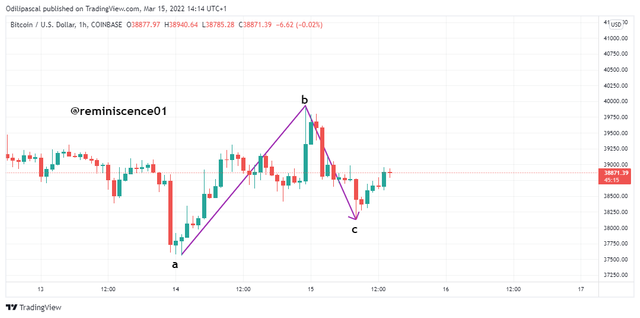
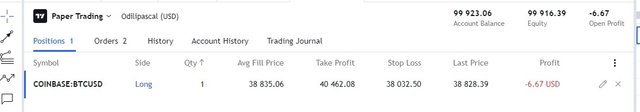
On BTC/USDT chart above, I noticed price was in an uptrend before creating a high at $39972. After that, price pulled back to $38122 before reversing back to the opposite direction. Capitalizing on this retracement for a buy trade, I opened a buy position on BTC/USDT as price reversed back up with stoploss placed below the low point. To determine the extent price will reach to set my take profit position, I drew a Fibonacci extension tool as shown below.
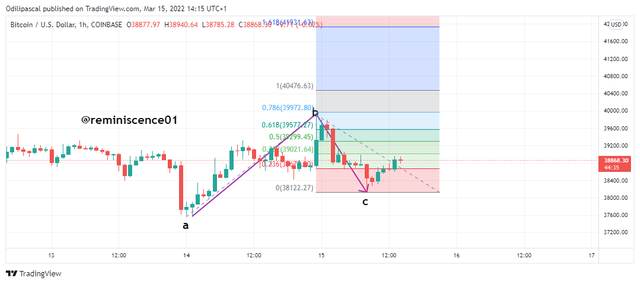
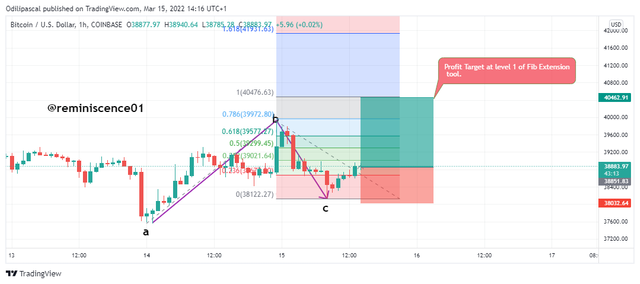
Here, I drew the Fibonacci extension from point (a) which is the start of the trend to point (b) which is the end of the trend. The finally to point (c) is the end of the pullback. The Fibonacci extension levels were displayed on the chart. I set my take-profit position at Fibonacci level 1( $40476). This level is where price is likely to reach before a retracement.
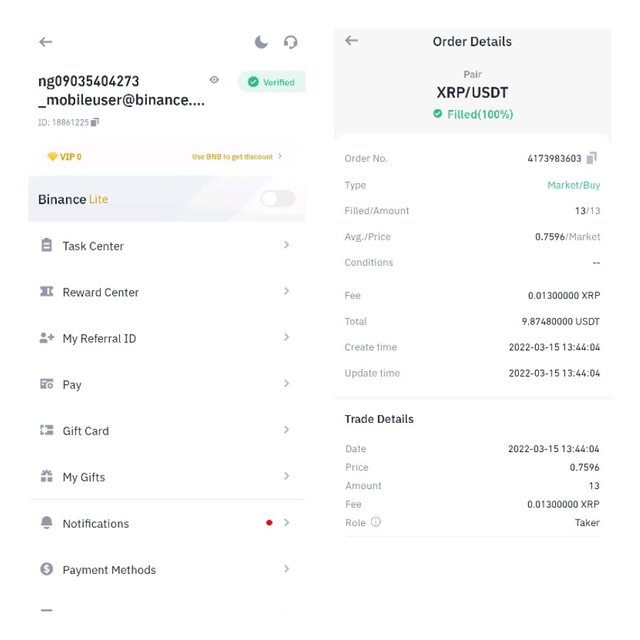
Details of transactions can be shown below.
Conclusion
Fibonacci tools are great technical analysis tools in the market today. The Fibonacci retracement tool is a good trend continuation tool that can spot support and resistance levels during pullbacks in a trending market. A trader can utilize this tool to find an entry position as well as take profit positions in the market.
Also, the Fibonacci extension is another great tool that determines how far price can reach before a pullback. Traders can majorly use this tool to set profit targets after a pullback. A trader should understand that price can reverse at any of these levels. You just have to be careful and watch out for trend continuation signals before making an entry.
Thank you professor @pelon53 for this amazing lesson on Fibonacci tools.