Steem Trading Analysis 1/20/18 - Rally to .0005! - Rising Trendline and Structural Support back to All-time Highs!
Steem has lost some momentum
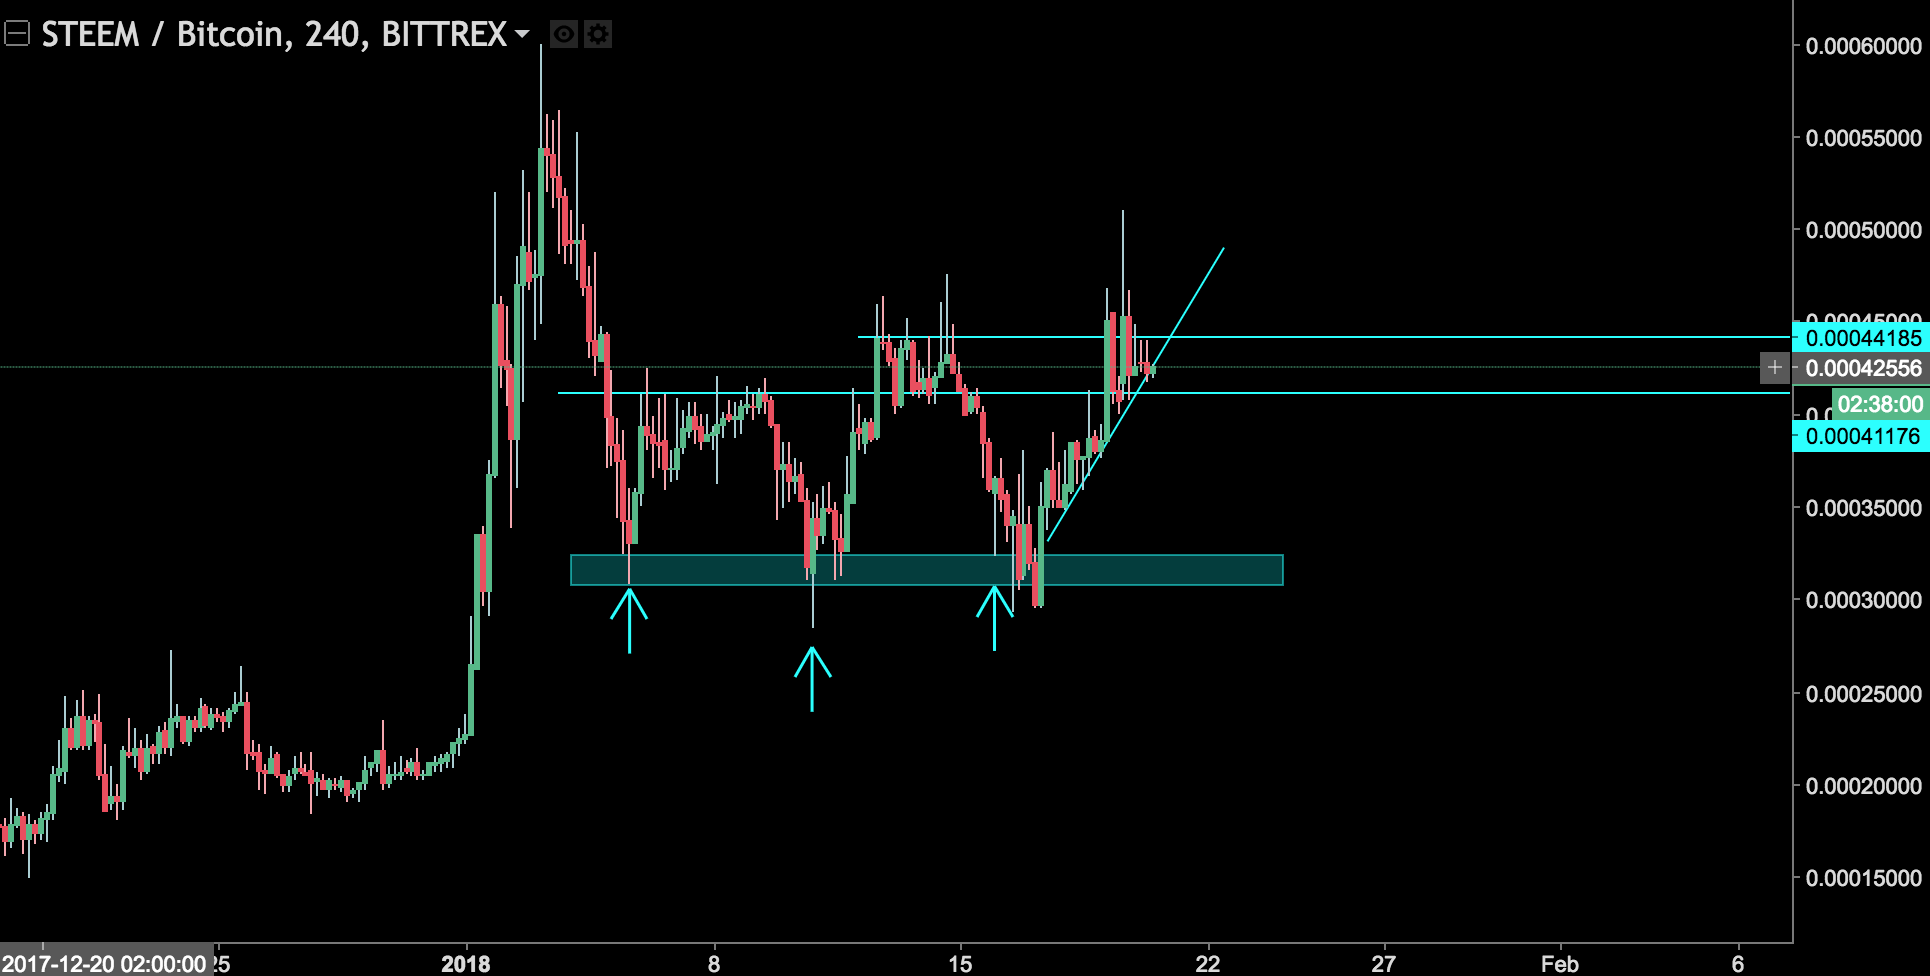
Steem is currently in a bit of a flux, as it recently has rallied back towards the .0005 price structure on the back of a very steep rising trendline. However, it has seem to have lost some momentum at the .00044 resistance area and started to dwindle. This situation creates some doubts as to whether or not Steem will continue the short term rally back towards the promise land of .0005! As we have reached a reaction point, I've broken down possible scenarios that we can watch out for.
Rising Trendline Potentially Broken
As you can see below, the angle of the trend line is INCREDIBLY steep. We saw a quick rally after hitting the .00032 demand zone back to last week's high. However, with candles creating large wicks attempting to break out of the .00044 resistance area, we have solidified the fact that this is a strong structural resistance and a reaction point for traders to start looking to take a position. Below are 2 scenarios where I see this going.
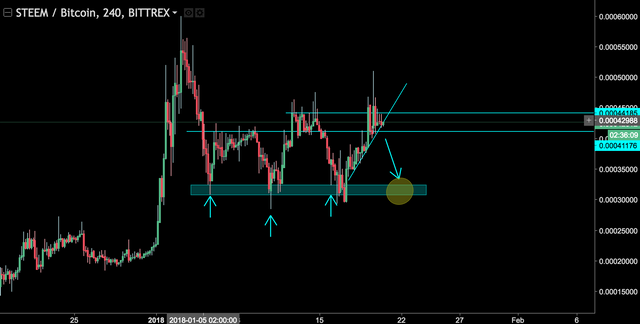
Scenario 1: Bearish break to .00032
The first scenario is a clear bearish break back towards the demand zone of .00032. We may see some very small correctional candles within the channel that price is currently trapped in, but if it were to go truly bullish then we'll see some large momentum red candles driving price back down. It's worth noting that Steem has been moving very consistently with the way crypto markets react, bullish and bearish - so it's worth looking into how currencies like Stellar or Ripple are trading to get an idea of where price might go in the short term.
Scenario 2: Correction within the Channel & Potential Rally to .0005
The dream scenario is that we see a flag candle formation inside the channel, and an eventual rally back toward the .0005 price area. This is what every steemer wants in life, and is a real possibility as cryptocurrencies in general are beginning to rally after a very bearish week. Once the price creates a very bullish candle to close outside of the .00044 price point, it's time to go long!
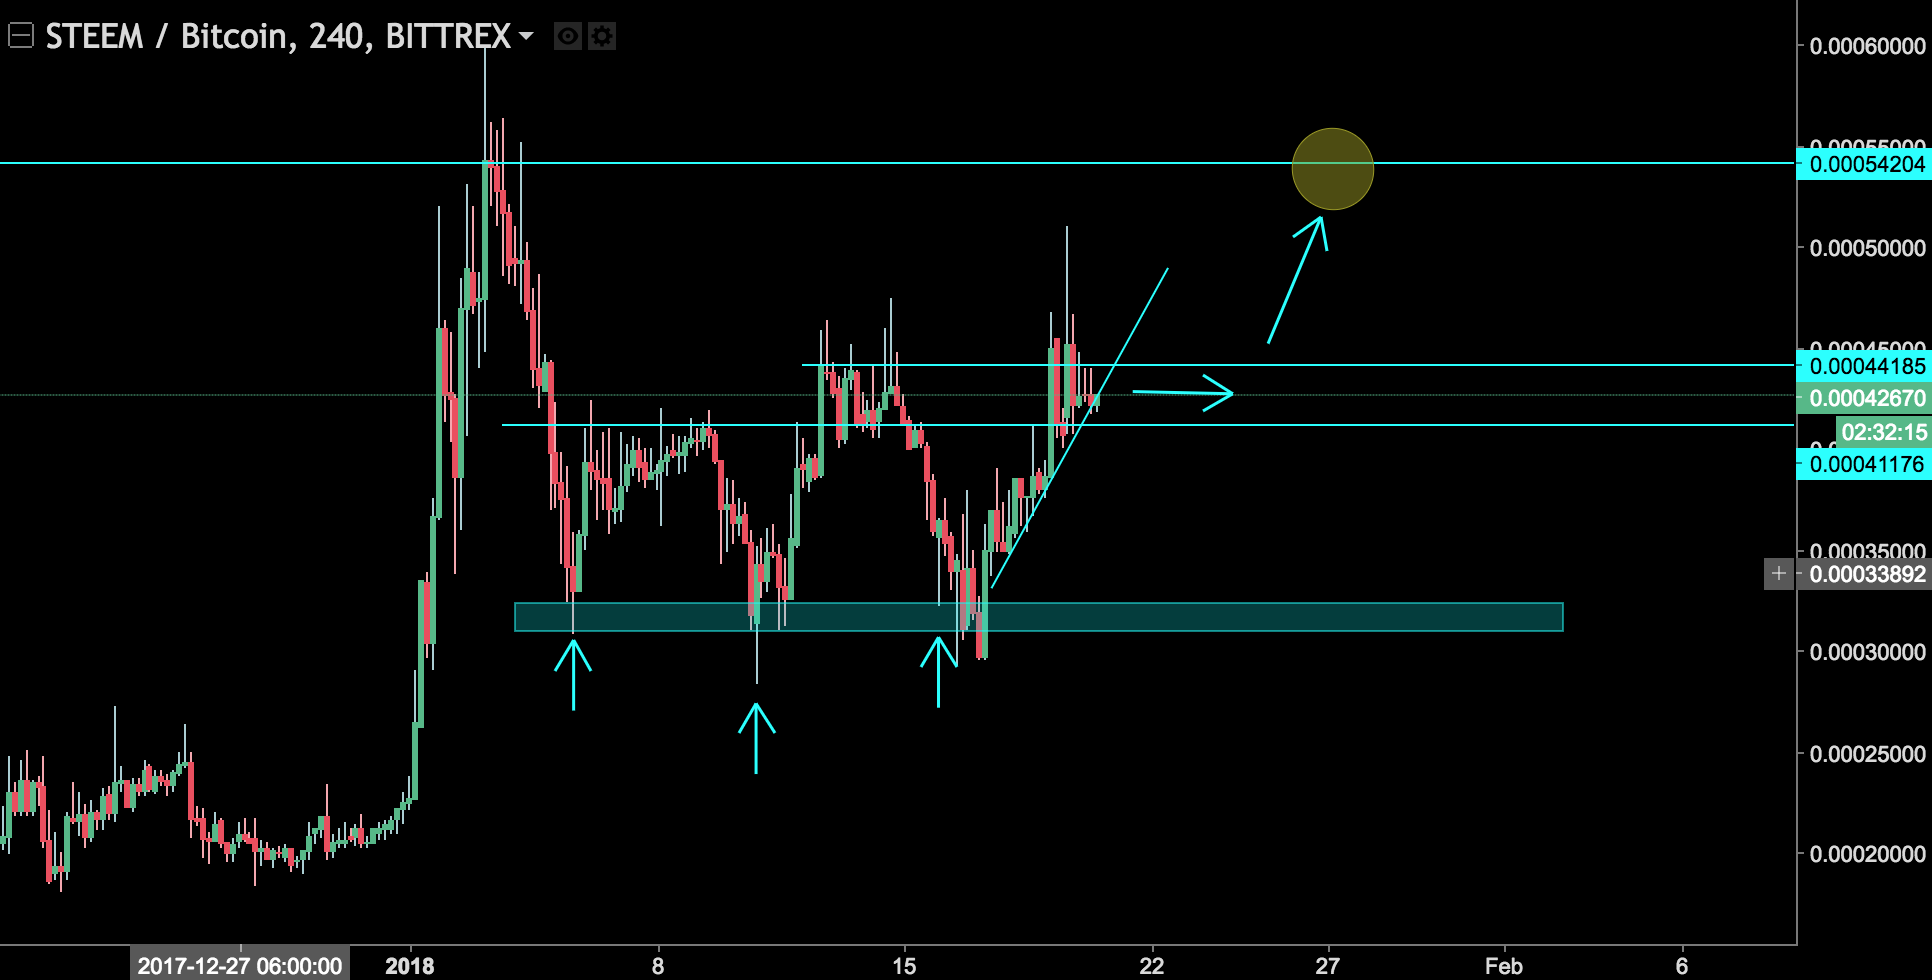
The key is to wait for the candles to close outside of the .00041 or the .00044 structural areas. Once that happens, then adjust your trading bias accordingly and take a position once you start seeing momentum.
Happy Trading!
Thank you for well-structured material, @r3negadetrader. I'll wait a bit with purchasing the altcoins, so it was clear, what direction is chosen by BTC. If it will strike, it will probably push down other coins. BTC dominance is 34,5% now - not a lot.
Absolutely! It seems like BTC will continue that trend as the most widely adopted coin, especially since it has a ton of room for growth in terms of markets that havn't been heavily penetrated yet.
Overall, I'm just going by candle signals either bullish or bearish, they tend to work as great signals compared to trading forex.
@originalworks
Your Post Has Been Featured on @Resteemable!
Feature any Steemit post using resteemit.com!
How It Works:
1. Take Any Steemit URL
2. Erase
https://3. Type
reGet Featured Instantly – Featured Posts are voted every 2.4hrs
Join the Curation Team Here