Key Weekly Plays in the Forex Market
We have some very interesting plays this week in the forex market! Lot of key levels being either respected or broken. Below are a few of the plays we have spotted:
AUDUSD
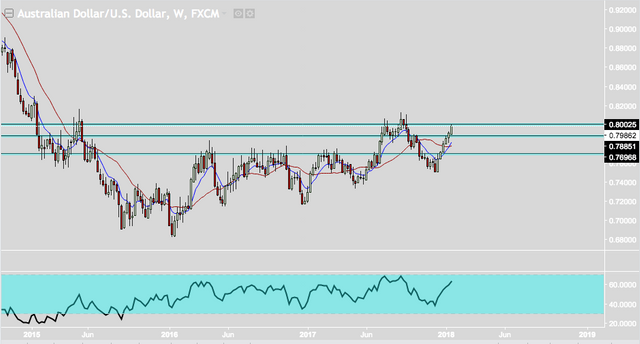
AUDUSD is at a major....and I mean MAJOR psychological level here approaching .8000. A common price action play that we tend to see on AUDUSD with major levels like this is whipsawing by the market makers.
They will grab stops on either sides and flush the market out before continuing the next move.
The ideal play on this is to sit patiently and wait for one side to break and price to retest the level. Then we will look for key candlestick patterns to play off of once that happens
EURUSD
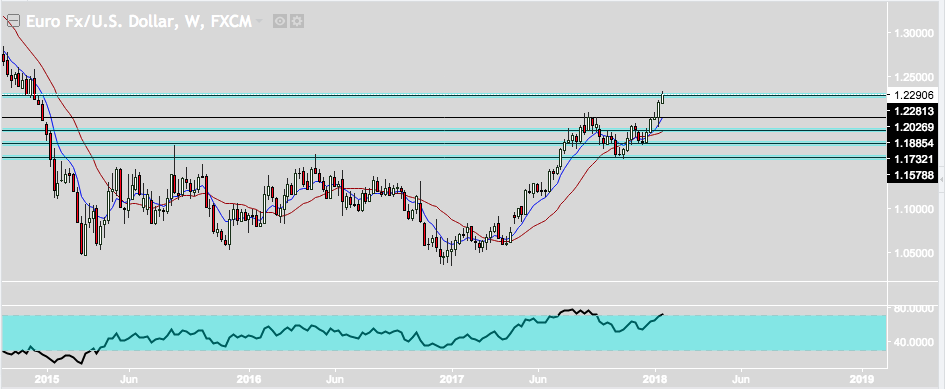
EURUSD seem to can't stop making new highs! The level we have marked here on the weekly chart at roughly 1.2300 is a level that goes way back into past price history that we could mark off.
RSI has been showing strong signs of divergence (new highs on the weekly chart but lower highs on the RSI indicator ), which indicates that EURUSD may soon begin its decent.
USDJPY
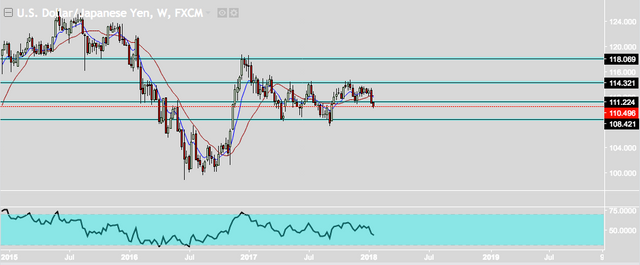
This is our favorite play of the week at the moment which we are currently short on.
We had a strong bearish weekly candle closure last week of a major level of support at 111.00. The candle closed right at 110.99, small difference but indication that 111.00 isn't respected.
USDJPY continues it decent and we foresee targets of roughly 108.50.
EURGBP
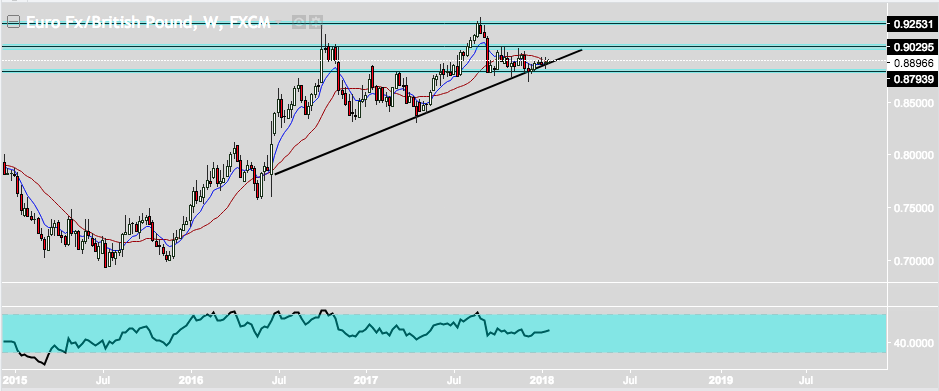
EURGBP is testing a major trendline on the weekly chart and displaying some decent bullish candles supporting off the trendline itself.
Remember this is the weekly chart so candlestick patterns will have more validity than they would on say a 15-minute chart.
We will be monitoring this closely and waiting for any bullish engulfing candle closure on the daily time frame to go long on.
CADJPY
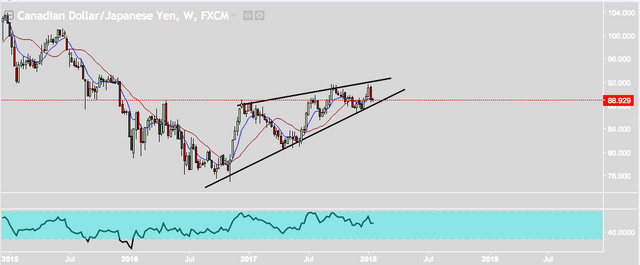
CADJPY is forming a rising wedge on the weekly chart. Last week, CADJPY closed with a strong bearish engulfing candle which shows that price has further room to the downside down until the trendline that we are approaching. From there we see an imminent bounce up unless the candlesticks show otherwise.
Those are our top plays for the week, happy trading!!
picture by @tanvirsadatripon
Hi my best friends
I have up-voted your post from 225% to 300%
Resteemed to my 750 followers
I love you
I wish to hear from you always.
When you make new posts with new pictures please write to me.... i will use them in your name inside my comments
Friends for ever
red-rose
@originalworks
You got a 1.21% upvote from @mercurybot courtesy of @r3negadetrader!
Your Post Has Been Featured on @Resteemable!
Feature any Steemit post using resteemit.com!
How It Works:
1. Take Any Steemit URL
2. Erase
https://3. Type
reGet Featured Instantly – Featured Posts are voted every 2.4hrs
Join the Curation Team Here
This post received a 5.63% upvote from @morwhale team thanks to @r3negadetrader! For more information, click here! , TeamMorocco! .
STEEM Price : 5.748 $ ID : 1516161399000