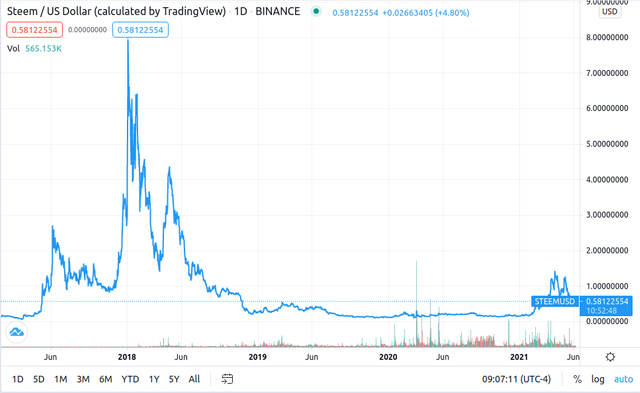
SBD Has Been At A Plateau, While STEEM Is Still At A Lowland
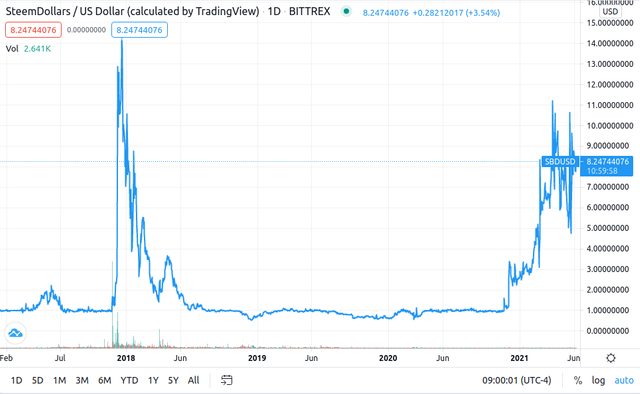
(Chart by TradingView)
In the chart above, we can see that SBD has been currently at a plateau. Almost the same high that SBD had when it was going through a bullish period at the end of 2017. In 19 Dec 2017, SBD peaked at $14.38 USD with volume of $451,551 USD. And in 2 Apr 2021, SBD again peaked at $11.21 USD with volume of $25,936 USD.
Meanwhile, on the lower chart we see that STEEM is still at a lowland. Much lower than the level of STEEM when it was going through a bullish period in early 2018. In 2 Jan 2018, STEEM peaked at $6.6 USD with volume of $54,739 USD. But in 11 Apr 2021, STEEM only peaked at $1.3 with volume of $4,027,000 USD.
Also note the trading volume of SBD and STEEM during the bullish period three years ago and now. Three years ago, the volume of SBD was more than 8 times the volume of STEEM. A bullish SBD could easily induce STEEM to become bullish too. Like a heavy train pulling a light wagon.
Meanwhile, this time the volume of SBD is only 0.006 times the volume of STEEM. No matter how bullish SBD is, it is very, very hard to attract STEEM so that it too becomes bullish. Like a light train trying to pull a much heavier wagon.
For SBD to attract STEEM this time, it has to reach a much higher peak price or take much longer time. Which one do you think comes first?
See also:
Sbd to the mars..👍😁😁
You got a 24.59% upvote from @bidvote courtesy of @puncakbukit!
This post has received a 59.75 % upvote from @boomerang.