Candlestick Patterns - Steemit Crypto Academy Season 5 - Homework Post for Task 10 by @pratikjumle29

Hello Everyone on Steemit! Greetings to all of you. My name is Pratik Jumle and I'm from India. I have read the professor @reminiscence01's post on the topic of "CANDLESTICK PATTERNS". After studying it here I'm writing this post as a homework on Question 1:
a)Explain the Japanese candlestick chart? (Original screenshot required).
b) In your own words, explain why the Japanese Candlestick chart is the most used in the financial market.
c) Describe a bullish and a bearish candle. Also, explain its anatomy. (Original screenshot required)

Explain the Japanese candlestick chart? (Original screenshot required)
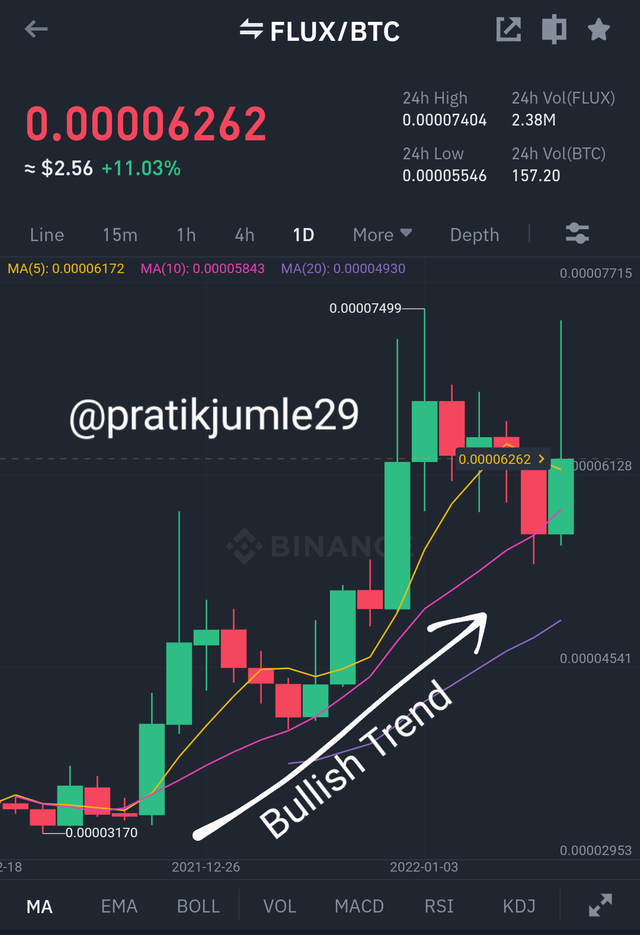
In simple language we can define The Japanese candlestick chart as the representation of values of an asset through a graph made up from two different coloured candlesticks i.e. Bearish candlestick and bullish candlestick. Where GREEN colour represents the bullish candlestick and RED colour represents the Bearish candlestick. As you can see in the screenshot below:
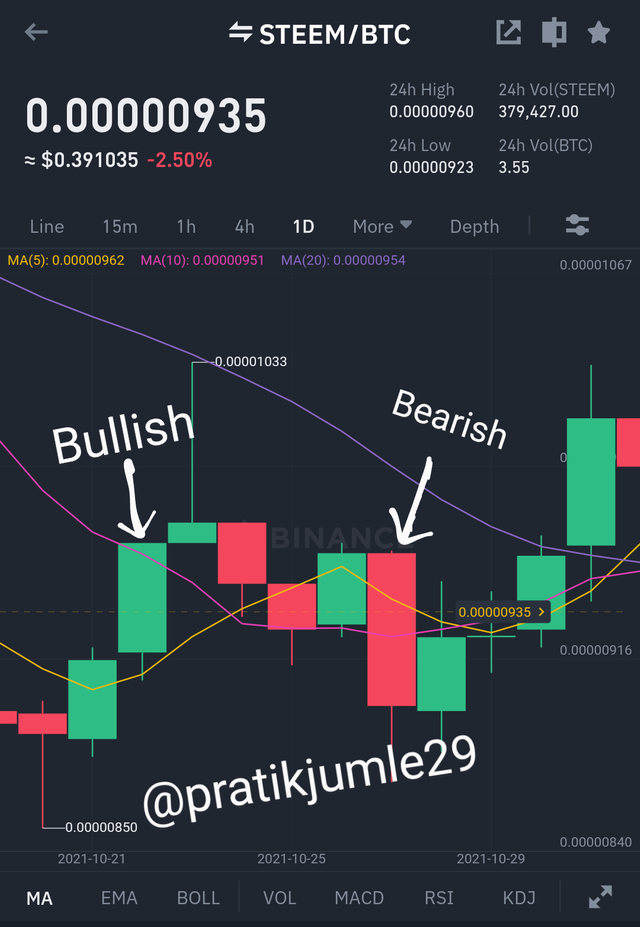
[Screenshot taken from my binance account]
This Japanese candlestick chart was founded in 1700s in the country Japan by a Rice trader named Munehisa Homma aiming to understand the supply and demand in the market and to keep a track on price rotation. And after invention of this chart the trading become very easy and also we use this chart to identify the uptrend and downtrend while trading. Moreover, this chart is very user-friendly and easy to understand.
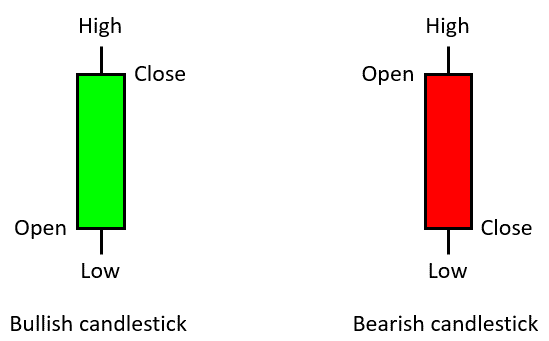
The two candlesticks have their own importance and features. Although both the candle helps traders to get a basic idea about the trend and price fluctuations. This two candles consists of 4 parts which are, The High, Low, Open and Close. we will discuss about this parts more briefly in the next question.
Generally, a trader always want to see the bullish candlestick on the graph more than bearish. Because traders can make a very good profit while the market is Bearish. Traders always enters the market after seeing Bearish candle and takes out a good profit. Whereas the bullish candle is totally opposite of Bearish candle. Usually, the traders stops trading after seeing the Bearish candlestick and leaves the market in order to avoid loss. Hence, this two candles are very significant for traders to decide when to enter and exit the market.
In your own words, explain why the Japanese Candlestick chart is the most used in the financial market.
Nowadays, mostly people prefer using Japanese Candlestick Chart due to its easy to understand interface. This chart helps people to analyse the financial market with ease.
This Japanese Candlestick Chart helps traders to take best decision according to the current status of market. Due to this the traders got to know that when to enter and make profit and when to exit market to stop loss at a specific moment. Moreover, traders can know the maximum and minimum prices of assets and the opening price & closing price of assets at a particular time period due to its four dimensional feature.
Its another very helpful feature is a trader can easily identify the ongoing trend in the market which can be bullish or Bearish trend.
Also by studying this chart carefully traders can easily pretend the future prices of assets.
In short i can say that Japanese Candlestick chart gives the more accurate and detailed information of price movements as compared to other charts in the market.
Describe a bullish and a bearish candle. Also, explain its anatomy. (Original screenshot required)
Firstly It is very important to learn about the Bearish and bullish candles for a trader. This candles have a huge impact on the trading process because if a trader tries to trade without studying this candles their a very big chance of facing loss but when a trader do trades after studying this two candles (bearish & bullish) he will definitely get a better idea of current market conditions and he will surely make some good profit! For example if the market trend is bullish the traders can will surely enter the market with low concerns.
By studying this two candles a trader can accurately predict the market movements very easily due to the simple understanding level of this candles.
I have explained this two candles in brief as follows :
Bullish Candle
The bullish Candle is one of the two candles in the Japanese Candlestick Chart. it's a very useful and valuable candle which represents the bullish trend in trading market which means that their is a increase in the price of asset which you wish to trade. And increase in the price of assets are always considered as the best time to trade for gaining maximum profit. Because of this candle it is easy for traders to make a sureshot decision about trading assets.
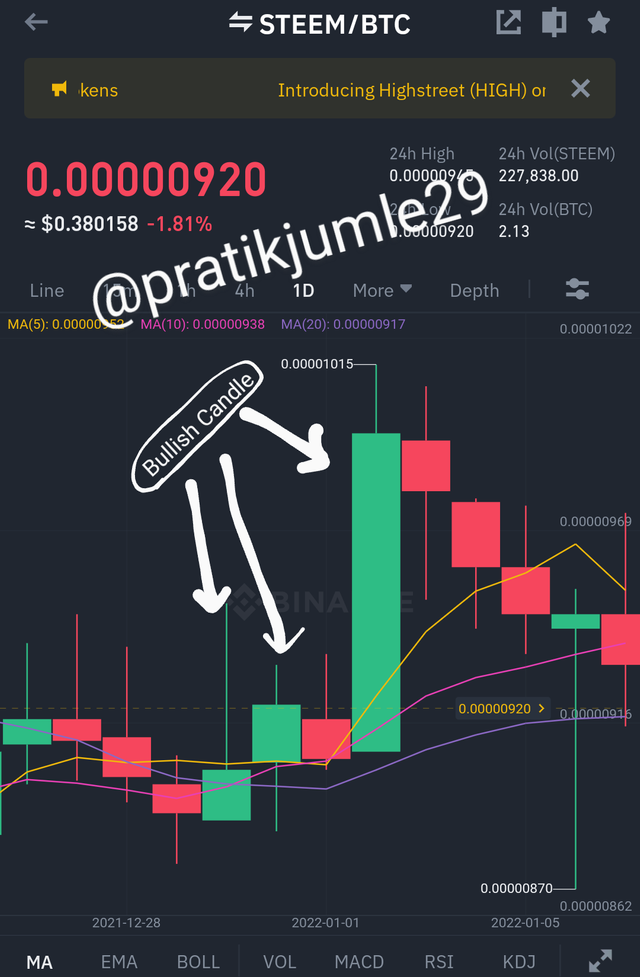
[Screenshot taken from my binance account]
Anatomy of Bullish Candle :
The bullish candle is made up from 4 parts namely- High, Open, Close, Low as you can see in the image below:-
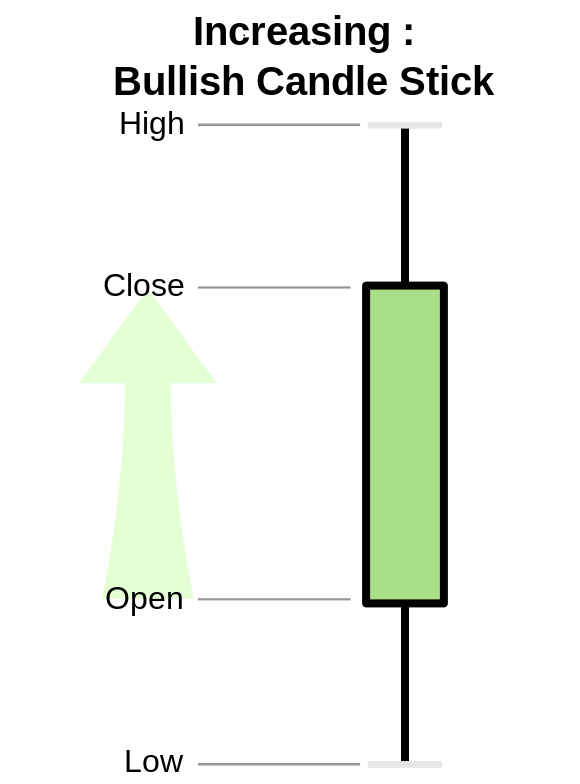
The High
In Bullish Candle the High point means the maximum price of a particular asset reached at a particular time/movement.It is very important for traders to take a look at high point of the bullish candle in order to trade in bullish trend.
The low
The Low point of the bullish candle is totally opposite of high. It represents the minimum price of an asset at a particular period of time and movement.
The Open
The open point of the bullish candle indicates the price at which the market of a particular asset opens or starts in a particular day/time.
The Close
The close point of a bullish market indicates the closing price of an asset Just like the open point shows the opening price on the candle. This is also a markable point for traders.
Through the below screenshot i have illustrated the bullish trend in the market:

Bearish Candle
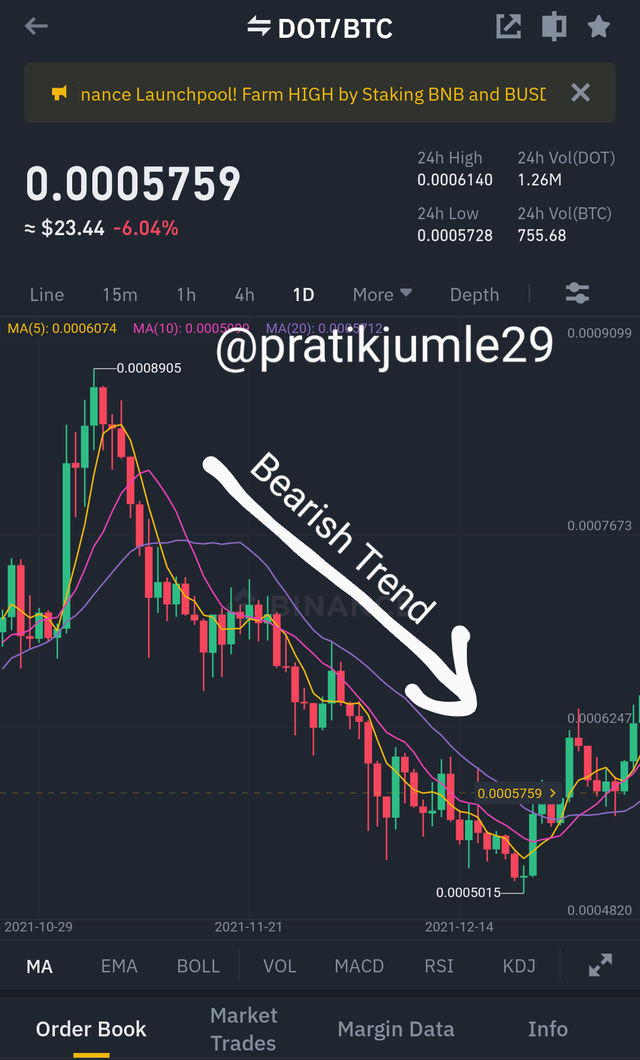
The bearish candle is one of the two candlesticks used in the Japanese candlestick chart. This candle also have its own importance and value in the chart. This candle represents the bearish trend in the trading market. In this candle we can see a decline in the prices of assets which indicates a negative signal for the traders. When this candle is displayed mostly traders chose to exit the market as soon as possible! It is also a key factor while making decisions.
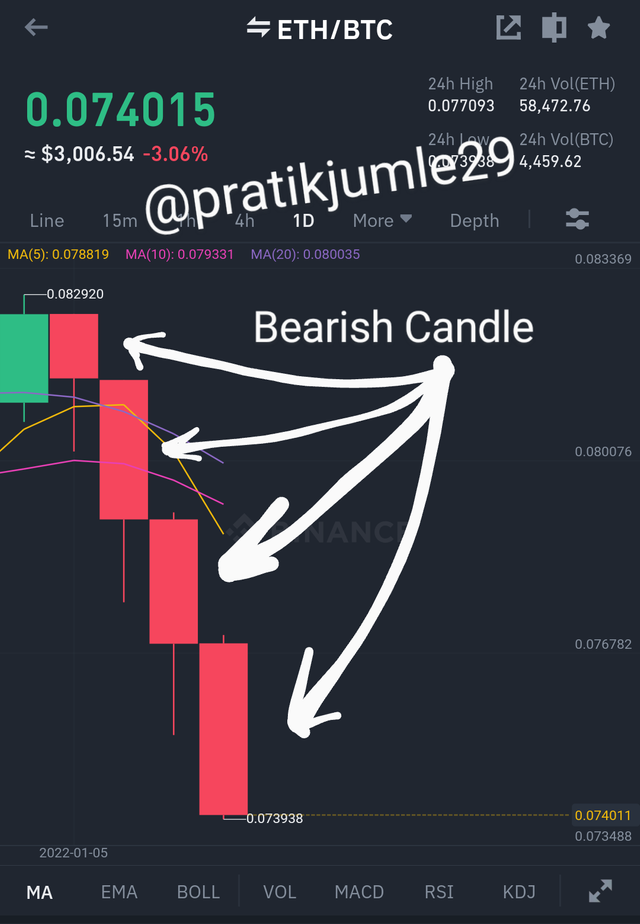
(Screenshot taken on Binance through my account)
Anatomy of Bearish Candle :
The bearish candle is also made up of 4 parts just like the bullish Candle. The 4 parts are namely- High, Low, Open & Close.
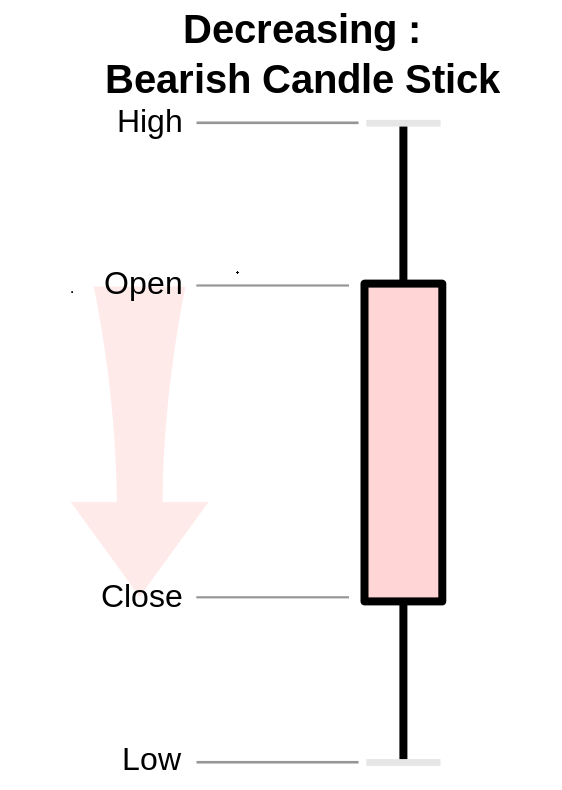
The High
The High point in a bearish candle represents the maximum value/price of an particular asset reached at a particular moment in the Japanese Candlestick Chart. It is very important for traders to watch this point carefully.
The low
Th Low point is just an opposite of high point. It indicates the minimum price of an asset in the trading market at a particular time/moment.
The Open
The open point of a bearish candle is the price of an asset at which the market opens in a specific day.
The Close
The Close point of a bearish candle is just the inverse of the opening point of candle. It represents the price) value at which the market is closed. This is also an important point for the traders to be noted.
Here in the below screenshot i have shown the bearing trend in the market :-
Conclusion
The Japanese Candlestick Chart is very important for traders. It is simple to understand and Study. Through this charts the traders can easily get the knowledge of ongoing trend in the market of a particular asset. Hence they can opt to invest or exit the market without any confusion.
Professor @reminiscence01 have written a wonderful lecture on the Candlestick patterns . Through his lecture i understood the concept of the Japanese Candlestick Chart very easily!
Thanks for Reading!
Regards
@pratikjumle29