Bichi Indicative Strategy- Steemit Crypto Academy- S5W6-Homework post for @utsavsaxena11

Welcome to the 6th week of the season 5 SteemitCryptoAcademy intermediate lecture by Professor @utsavsaxena11.
Without wasting much of our time, let me quickly proceed with the given tasks.

QUESTION 1
Give a detailed analysis of BICHI STRATEGY. Staring from introduction, identification of trends, trend reversal in market, entry and exit from the market, one demo trade and finally your opinion about this strategy. (Screenshot required).
INTRODUCTION
Trading cryptocurrencies can simply be regarded as an act of speculation on the possible price movement of an asset in other to either buy or sell the asset to make profits.
Trading cryptocurrencies comes with high risk due to its high level of price fluctuations (volatility) and for this reason, a lot of trading strategies have been developed by traders to maximize profit and minimize loss.
These strategies are developed based on the type of trading analysis which can be either fundamental or technical with the former based on the type of current news and information regarding a particular cryptocurrency. This in turn makes a trader either buy or sell the crypto asset.
The latter which is technical analysis deals with market analysis using either technical analysis tools (indicators) or simply price action techniques (chart interpretation).
The use of indicators can be regarded as the most common trading strategy and for that reason, a lot of good traders have been coming up with different combinations of indicators thereby making up a good indicator-based strategy.
This development of various indicator-based trading strategies is what has led to the development of the Bichi Method Of Indicative Strategy.
The BICHI STRATEGY is a trading strategy developed by Utsav Saxena.
Utsav Saxena who hails from New Delhi, India, is a SteemitCryptoAcademy intermediate professor and a good trader judging from the type of trading lectures he gives which includes;
Trading Strategy for Head and Shoulders and Inverted Head and Shoulders Pattern.
Trading With Puria Method Indicative Strategy | How To Make Our Strategy.
And now the Bichi Method Of Indicative Strategy.
Bichi Method Of Indicative Strategy which was developed by Utsav Saxena, is an indicator-based strategy that deals with the combination of two known technical indicators by name Bollinger bands and Ichimoku cloud.
Bollinger bands which is a trend-based indicator are used to tell the support and resistance of the overall price. When the price trends above the middle band, the middle band serves as a support and when it trends below, it serves as resistance.
Also, the Bollinger bands are used in the measurement of market volatility and identification of overbought and oversold regions.
While the Ichimoku cloud simply tells possible price movement by indicating a breakout from either direction. These breakouts signal a trader to either buy or sell an asset.
The combination of the above trading indicators (Bollinger bands) and (Ichimoku cloud) is what makes up the Bichi Method Of Indicative Strategy.
IDENTIFICATION OF TRENDS
Market trends can be identified using various trend indicators but here, we will be looking at how to identify trends using the Bichi Strategy.
UPTREND
In identifying an uptrend movement using the Bichi Strategy, we will first identify the position of the baseline of the Bollinger bands.
If the basis line serves as a support to the price chart, we will then be on a lookout to see when the price breaks above the Ichimoku clouds.
The breaking of the Ichimoku clouds indicator serves as a reconfirmation of the signal first produced by the Bollinger bands.
- screenshot
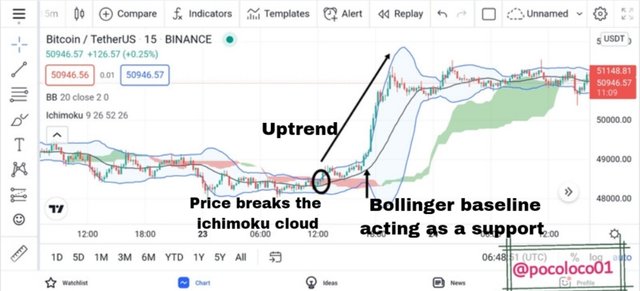
From the above, we will see that the price first breaks the baseline of the Bollinger band thereby turning it into support from the initial resistance it was.
Also, the price is seen to move above the Ichimoku cloud which serves as a confirmatory signal of an uptrend.
DOWNTREND
In the case of identifying a downtrend using the Bichi strategy, we first observe to see if the baseline of the Bollinger band is serving as a resistance or support to the price. If it is serving as resistance, we observe to see if the price has broken below the Ichimoku cloud which will serve as a confirmatory signal of a downtrend.
- Screenshot

From the above screenshot, we will see that the baseline of the Bollinger band is found above the price and shortly the price was found to break below the Ichimoku cloud thereby signaling the start of a bearish trend movement.
TREND REVERSAL
Trend reversal is simply the change in a price direction over time. This change in price direction could be either from upward to downward or downward to upward.
Previously, we have looked at trend reversal using the head-and-shoulder and inverse head-and-shoulder patterns. Currently, we will be looking at trend reversal using the BICHI STRATEGY.
BEARISH-TO-BULLISH
When the Bollinger band and price are both in an obvious downward trend as indicated by the baseline serving as a resistance to the price and the price trending below the Ichimoku cloud.
Soon after this, the market moves sideways together Bollinger band. This sideways trending of the market will cause the price to break the Ichimoku cloud several times.
When the above two have been observed in the market, a bearish-to-bullish trend reversal is expected to follow suit.
- Screenshot

Looking at the above M15 chart of BTC|USDT pair, you will notice that the price went downward which was followed by a sideways trend resulting in several breaking of the Ichimoku cloud thereby leading to a trend reversal.
BULLISH-TO-BEARISH TREND
The identification of bullish-to-bearish trend reversal using the BICHI strategy is the same as that of bearish-to-bullish trend reversal but opposite.
When the Bollinger band and price are both in obvious uptrend movement, soon after, the market moves sideways together with the Bollinger band. This sideways movement of the market often leads to multiple breaks of the Ichimoku cloud by the price chart.
When the above is observed, it signals a possible bullish-to-bearish reversal.
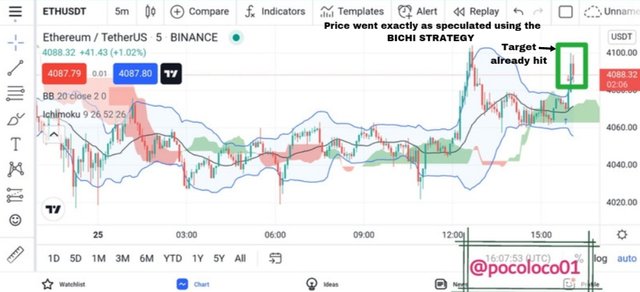
- Screenshot
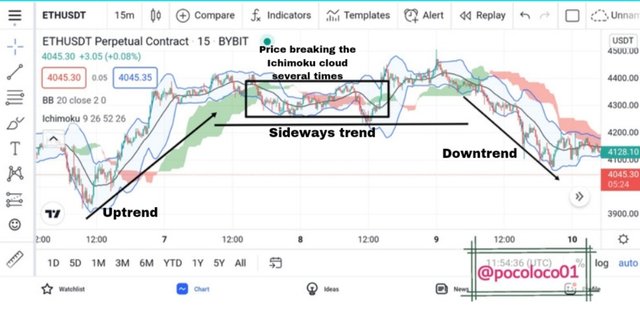
Looking at the above M15 chart of EHT|USDT pair, you will see that the price and Bollinger band are both in upward movement as indicated by the Ichimoku cloud trending below the price chart.
After which we saw a sideways trend with the price breaking the Ichimoku cloud several times.
The above two confirmations serve as a clear signal of a possible bullish-to-bearish trend reversal.
ENTRY AND EXIT
BUY POSITION
In taking a buy position using the BICHI strategy, we have to, first of all, identify an uptrend movement.
We now observe to see if the price is above the baseline of the Bollinger band with the baseline acting as a support.
After that, we don't just jump into taking a buy position. We will wait for the price to break above the Ichimoku cloud after which we make our entry.
- Screenshot
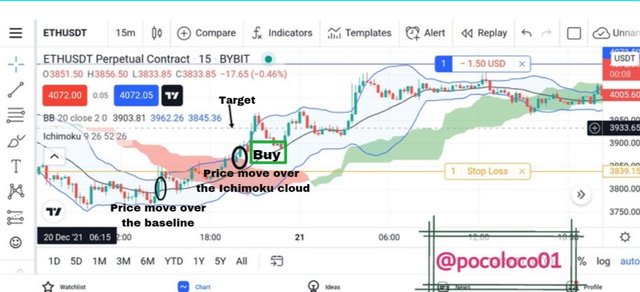
Looking at the above, you will see that the stop-loss is set to touch the support baseline of the Bollinger band with the take profit taken in a ratio of 1:2.
SELL POSITION
Similar to the buy position but opposite, the sell position is taken by first of all identifying a downtrend movement.
After which we observe to see if the price has moved below the baseline of the Bollinger band which will now in turn act as a resistance.
Now, we wait for the price to break below the Ichimoku cloud before taking a sell position.
- Screenshot

Looking at the above, you will see that the stop-loss is set to touch the resistance baseline of the Bollinger band and the target set in consideration of the stop-loss in a ratio of 1:2.
ONE DEMO TRADE
In this Demo trade, I will be taking a buy position using the BICHI strategy.
I will first identify the trend direction after which we look to find the support level which is given by the baseline of the Bollinger band.
Once the price is above the support level, I will wait for it to break the Ichimoku cloud before taking a buy position.
- Screenshot Of Market Analysis
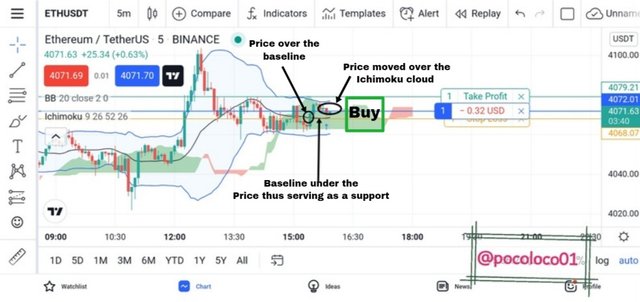
In the above trade, the risk-reward ratio which serves as my exit position is set at 1:1.
- After Analysis Screenshot
- Result

MY OPINION ABOUT THIS STRATEGY
◽The BICHI STRATEGY is a very simple and easy-to-use strategy with a high success rate of about 80%.
◽This strategy is favorable to scalpers due to its rate of efficiency in lower time frames which allows them to reduce the size of their stop-loss.
◽ The combination of the two indicators that makes up the BICHI STRATEGY is very good as it provides confluence which is very essential in trading.
◽In as much as the BICHI STRATEGY is very efficient, it also gives out false signals as a result of the multiple breaks that occur on the Ichimoku cloud during sideways trending.
Therefore, it requires constant practice and clear observation of breakouts in other to maximize profit and minimize loss.
QUESTION 2
Define briefly Crypto IDX and Altcoins IDX. What is signal prediction trading. Is it legal or ill-legal in your country. (Explain briefly)
CRYPTO IDX
Crypto IDX which is the short form of Cryptocurrency Index can simply be regarded as an average of 4 different cryptocurrencies which include; Bitcoin, Litcoin, Ethereum, and Zcash.
This synthetic asset is not found on any other cryptocurrency platform but only on Binomo and it takes into record the above-mentioned cryptocurrency supply and demand data and not just the values.
- Screenshots


The screenshot above is the chart of the cryptocurrency index on Binomo. The value which is currently at 641.868 (3sf) is the average of the four cryptocurrencies mentioned earlier and it is calculated using the help of software.
Also, looking at the above screenshots, you will observe that I decided to try out some trades on crypto IDX and it all went successful.
ALTCOINS IDX
Similar to the Crypto IDX is Altcoins IDX which is the combination of 4 cryptocurrencies which include; Ethereum, Ripple, Litcoin, and Monero.
Unlike Crypto IDX, Altcoins IDX, combines 4 cryptocurrencies excluding Bitcoin which in turn gave it the name Altcoins IDX.
This Synthetic is found on the Binomo platform and it takes into account the prices of the above-mentioned cryptocurrencies together with their supply and demand parameters.
- Screenshots
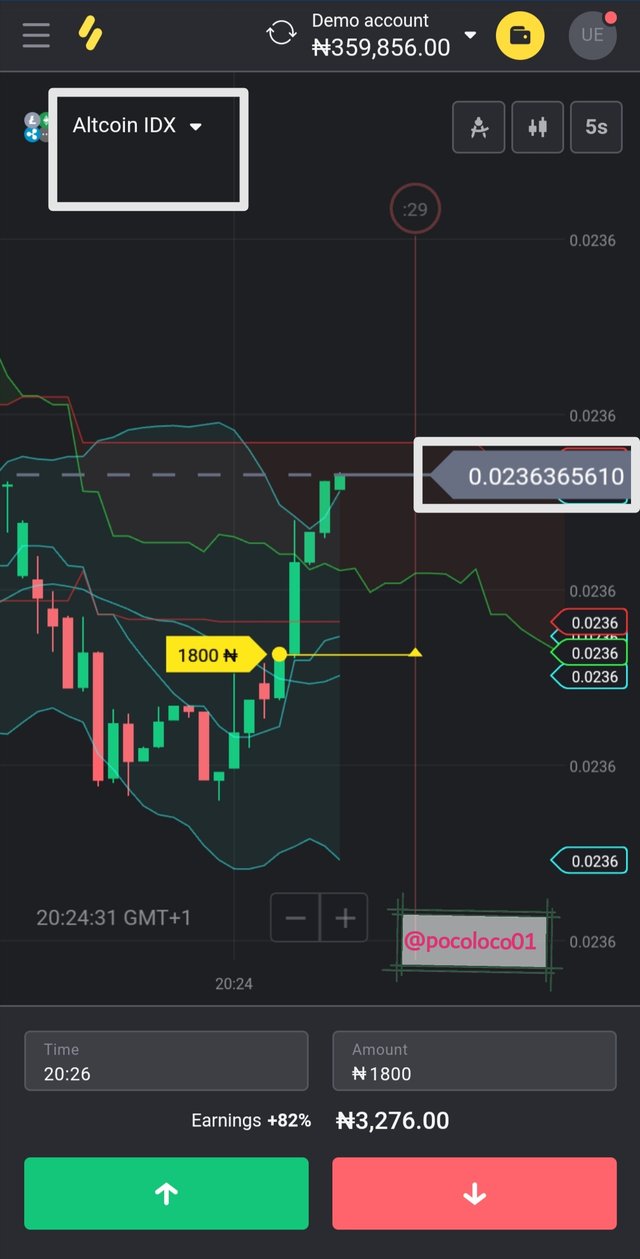
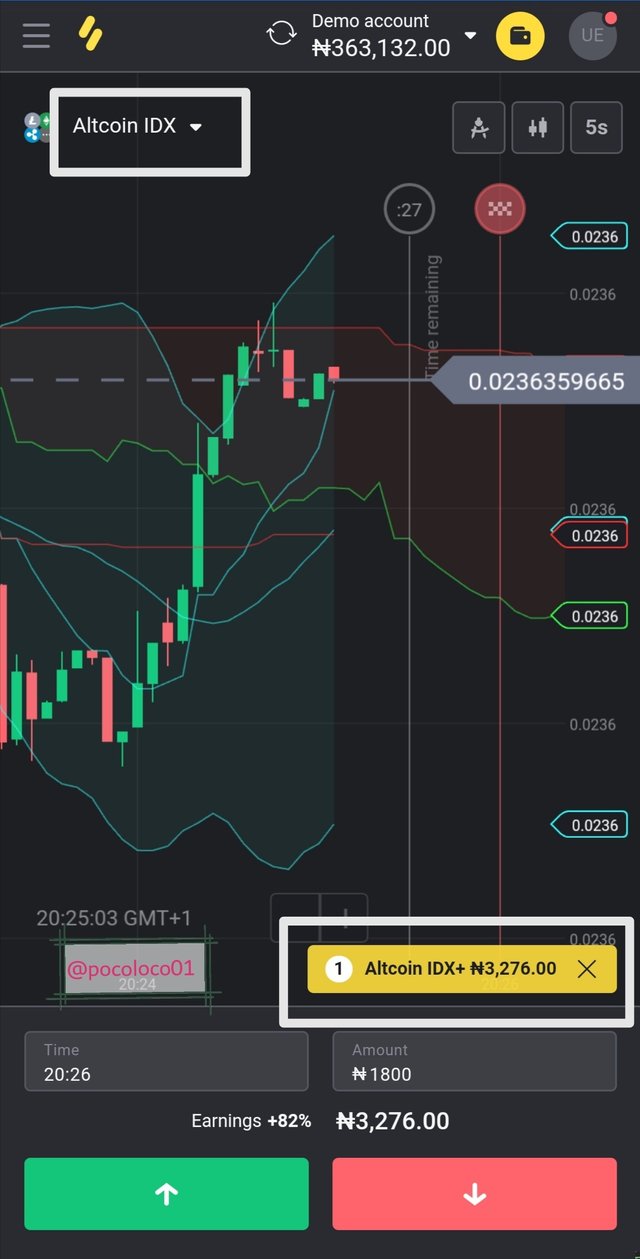
From the above screenshot, you will see the current value of Altcoins IDX which is currently at 0.0236359665. This value is the average of the four different cryptocurrencies mentioned earlier and it is calculated using the help of software.
Also, looking at the above, you will see that I traded on the Altcoins IDX and made a minor profit.
SIGNAL PREDICTION TRADING
This is a trading approach that deals with the speculation of the possible price direction of an asset over a given time.
This can be done manually or with the aid of automated trading software (bots). Doing it manually involves the use of technical, fundamental, or both analysis in predicting the future price movement of an asset.
The automated trading software on the other hand analyzes markets by taking into consideration certain information such as the current price and volatility levels of the market before executing trades.
IS IT LEGAL OR ILLEGAL IN MY COUNTRY
I will say that it is legal in my country because the Binomo platform is fully functional in my country unlike other banned platforms such as Twitter which can only be accessed using a VPN.
Also, the Binomo platform allows a full operation of a demo account using the native currency of my country which is the Nigerian Naira (₦).
In as much as the central bank of Nigeria banned local banks from processing cryptocurrency-related transactions, there is still no legal law against cryptocurrency trading as a whole.
QUESTION 3
If you want to create your own penny IDX, then which 4 penny assets will you choose and what what is the reason behind choosing those four assets. Define Penny currencies.(Explain, no screenshot required)
If I decide to create my own penny tokens, I will choose DOGE, WAXP, CHILIZ and XRP.
In choosing my penny tokens, I considered some important factors which include, liquidity, price, and potential.
DOGECOIN
Dogecoin is a cryptocurrency created by Billy Markus and Jackson Palmer in other to make a caricature of the existing cryptocurrencies at that time.
It is currently the leading meme token and among the top 15 cryptocurrencies in terms of market capitalization. It also has very good liquidity and it is available on various popular exchanges.
WAXP
WAXP is a digital currency that is used in the purchase of digital assets such as avatars, online collectibles, NFTs, etc. Is it also designed to make e-commerce transactions faster, safer, and easier?
It is among the top 10 Metaverse tokens in terms of market capitalization and with its price currently trading at $0.5064, shows that it is still early enough to invest in it adding to the increase in popularity of Metaverse.
CHILIZ
Chiliz is a very popular token built on the Ethereum blockchain. It allows club fans the ability to trade and acquire their club tokens listed on Socios.com.
Due to the increase in popularity of fan tokens, Chiliz will tend to get even more popular because club fans would like to purchase their various club tokens and this, in turn, will lead them into acquiring and holding Chiliz in other to easily trade it for any club token at any time.
The current price of Chiliz is $0.317 which is evidence that there is still room for massive growth
XRP
XRP is a blockchain-based token built primarily for payment and its speed of transaction is what has made it very popular in the cryptocurrency space.
It is currently among the top10 cryptocurrencies in terms of market capitalization with a current price of $0.93.
It also has very good liquidity and is currently trading on various exchanges.
DEFINE PENNY CURRENCIES
Penny currencies can simply be defined as currencies whose values are below $1.
Example of penny currencies includes; Dogecoin, WAXP, XRP, and Chiliz, etc.
CONCLUSION
Just as we have learned, the Bichi strategy is a combination of two indicators which are Bollinger band and Ichimoku cloud. These two indicators aid in identifying market trends, momentum, and level of volatility.
Also, the combination of these two indicators provides confluence which reduces false signals thereby making it possible for traders to maximize profit and minimize loss.
Special regards to professor @utsavsaxena11 for giving such a wonderful lecture filled with a lot of interesting knowledge.