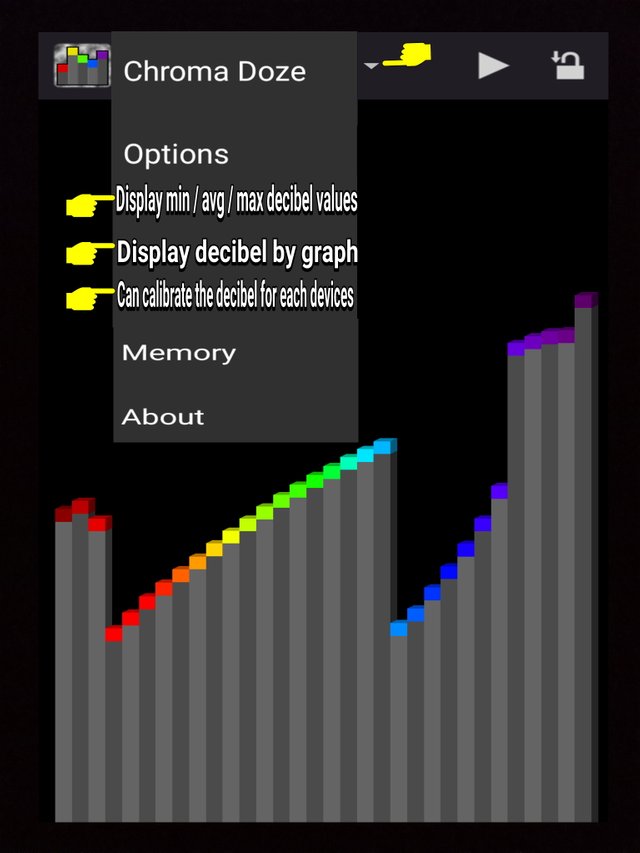
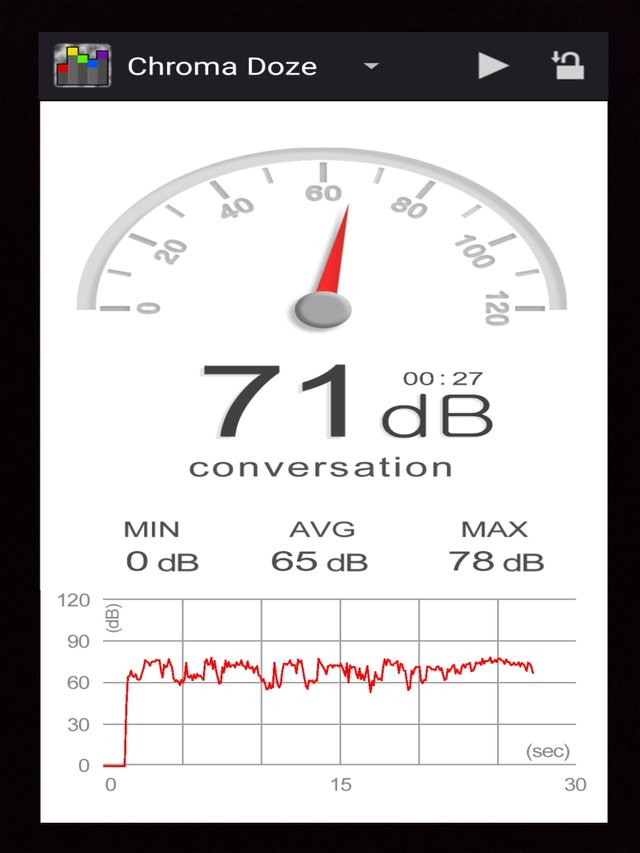
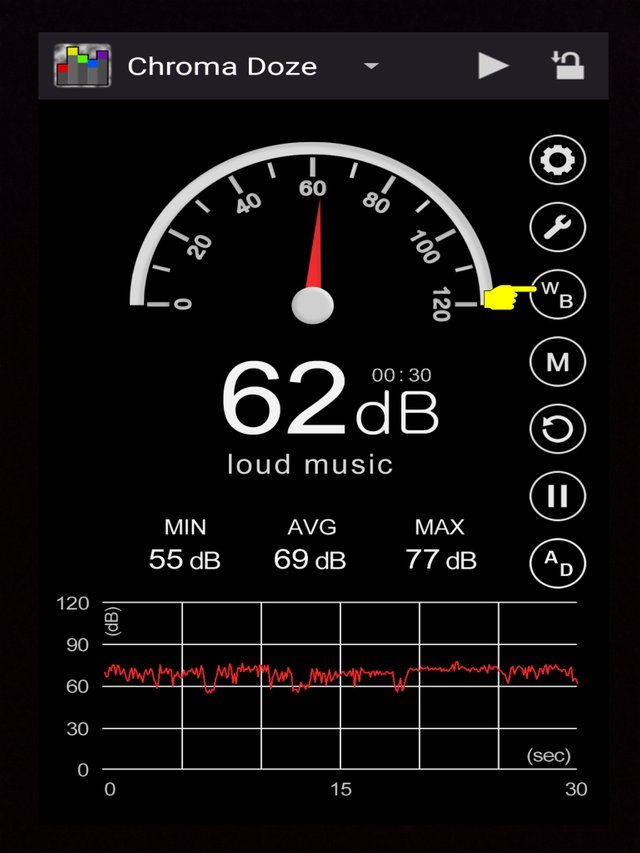
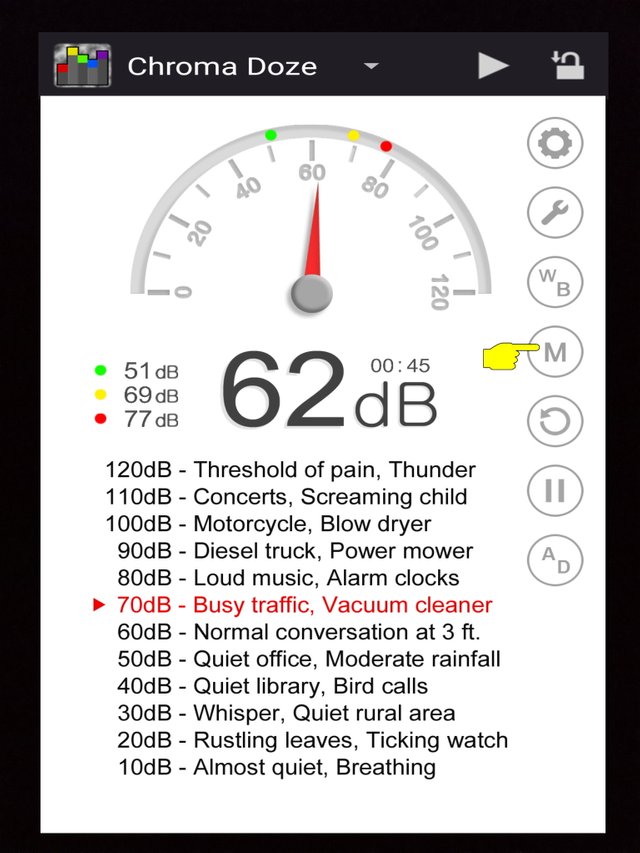
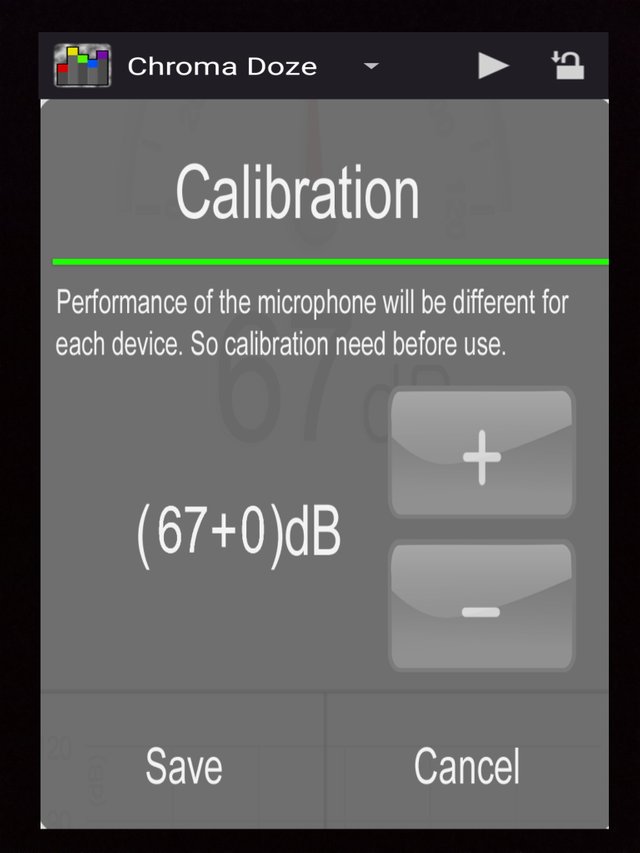
Add feature feature "Display min / avg / max decibel values" feature "Display decibel by graph" and "Can calibrate the decibel for each devices" feature in chroma doze application
Components
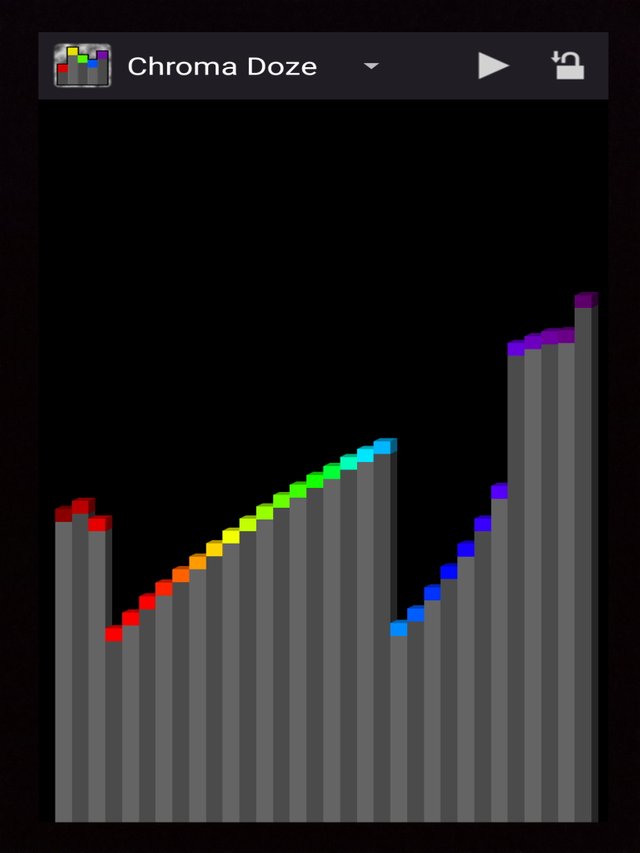
Chroma doze app is an application that can help sleep well with Fourier's calming algorithm analysis. Create a user favorite spectrum sketch and listen to the resulting white noise stream. Features no strange ads or permissions, not just rotating circular samples, relatively power-efficient, running in the background, saving user favorites in memory lists, containing maths, Open Source / Free Software (GPLv3 license).
Proposal
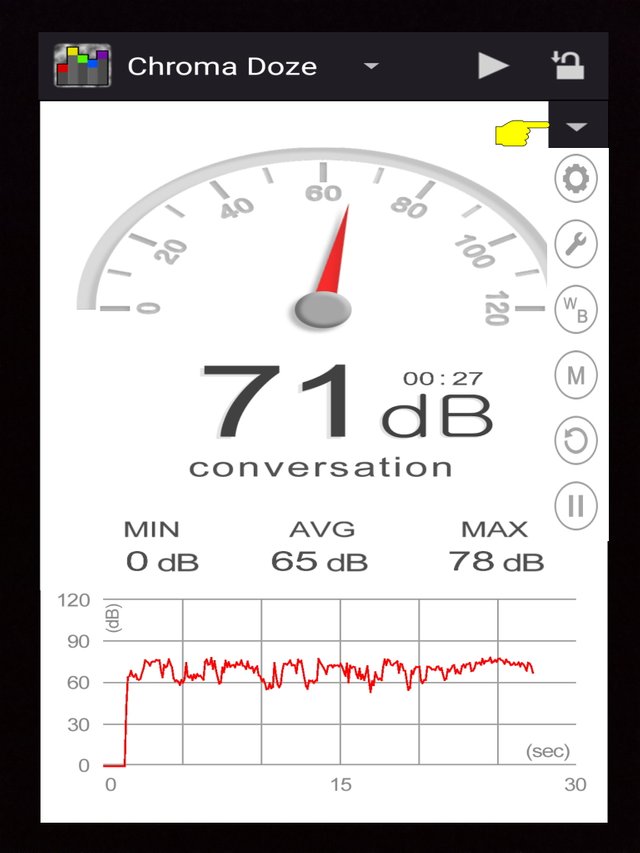
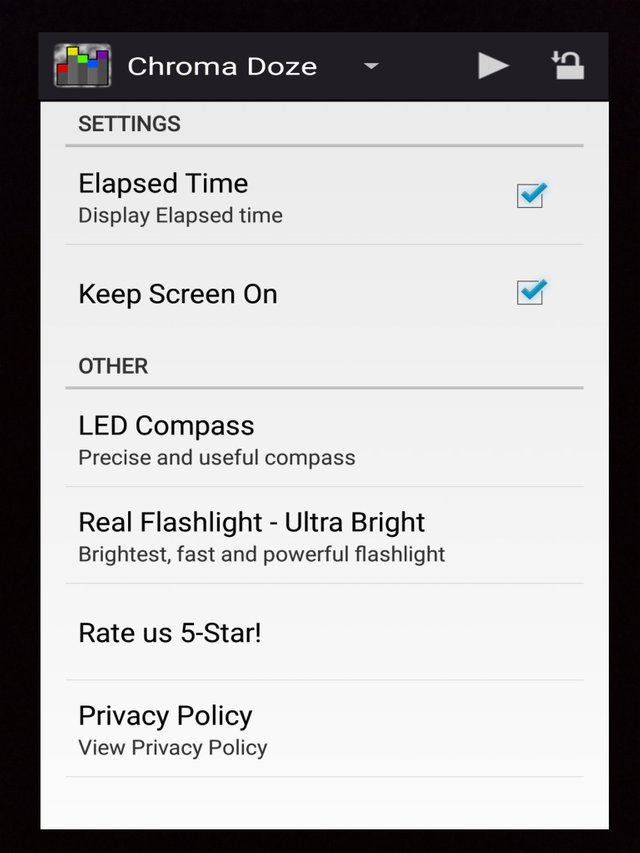
After installing a user's chroma app asleep can help you sleep soundly with Fourier's soothing algorithm algorithm. Create a user favorite spectrum sketch and listen to the resulting white noise stream. As a user, I propose to developers to add features "Display min / avg / max decibel values" feature "Display decibel by graph" and the feature "Can calibrate the decibel for each devices" on the part of the application toolbar chroma doze
Mockups / Examples
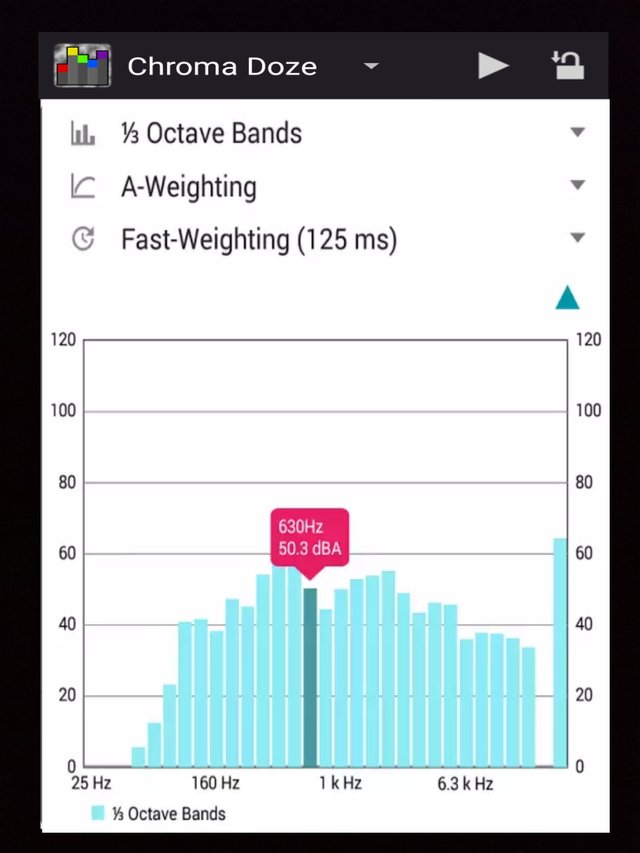
This is a sample image after the developer adds the "Display min / avg / max decibel values" feature "Display decibel by graph" and the "Can calibrate the decibel for each devices" feature in the chroma doze app.
Benefits
With the Display min / avg / max decibel values, Display decibels by graph and features Can calibrate the decibels for each devices allow users to show decibel values by measuring ambient noise, displaying dB values measured in various shapes. Users can also experience a neat graphic design with a high frame. The microphone in most android devices is aligned with the human voice. The maximum value is limited by device. A very loud sound (over ~ 90 dB) may not be recognized on most devices. So please use it only as a tool. drawing sound intensity graphs for users over time, so users can see how volumes are changing dynamically. Users can also set some volume levels as the user base, and measure all sounds relative to it. Users can also show decibel values by measuring environmental noise, displaying measured dB values in various forms. Users can experience a neat graphic design with frames. This is an exciting thing for the users and is a wonderful thing.
Posted on Utopian.io - Rewarding Open Source Contributors
Thank you for the contribution. It has been approved.
You can contact us on Discord.
[utopian-moderator]