Bitcoin - Analysis and Projection
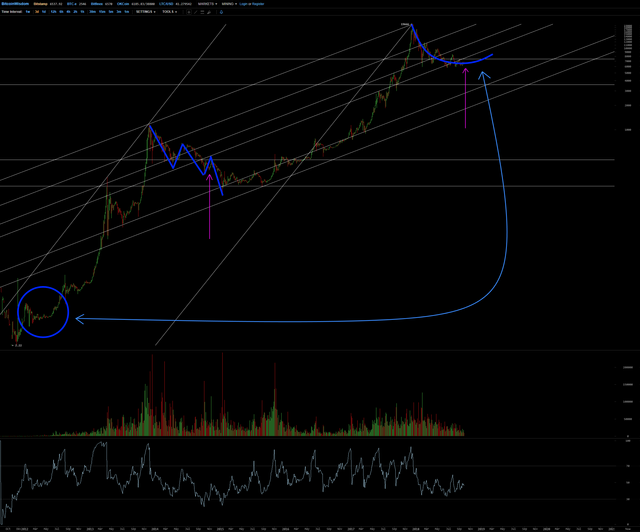
I made a projection of the last 2013-2017 Bitcoin cycle, connecting the 2013 ATH's with that of 2017.
The pink arrows show us where we were at the same time as now, 4 years ago in the cycle.
Theoretically, we could still expect a "savage" bearish move down, "Ladies and Gentleman".
But when we closely examine the moves after the "Mt Gox" peak, we see that the move down in 2014 was following a Elliott Wave pattern, whereas this year, we have another pattern, a "round bottom", like we had earlier as in 2012 (blue circle).
As we are in a consolidation market for about 4 months now moving on with higher Lows, I think the momentum of the Bitcoin curve is in favor of the Bulls for the months ahead.
i hope the end of the november bitcoin bullrun start
only bear mode to survive no sign of a bull run still