Wedge Patterns - Crypto Academy / S5W5 - Homework Post for @sachin08
.jpg)
This article is my homework elaboration for Beginner Level in Steemit Crypto Academy. Specifically, in the class of professor @sachin08 regarding Trading Using Wedge Pattern.

Question 1
Explain Wedge Pattern in your own word.
THE DEFINITION OF WEDGE PATTERN
Another technical analysis we will study this week is the Wedge Pattern. The wedge patterns are similar to the triangle pattern as our topic a few weeks ago. We can find the wedge pattern with the help of resistance and support levels. However, both resistance and support trendlines in the wedge patterns are gradients. There are no flat lines. The wedge pattern tends to show that reversal is about to happen.
Often, the distance between resistance and support trendlines is quite far at the beginning of the formation of wedge patterns. Regardless, because the price tendency cannot retain its strength, the different slopes of each trendline will eventually get closer at the end of the pattern formation. Consequently, forming a narrowing channel.
In addition to trendlines, traders should also pay attention to any breakouts in this pattern. When the price trend moves past one of its trends, the market is probably in a reverse direction. Wedge Patterns often appear on market charts. Therefore, many people use the wedge pattern technical analysis as their trading strategy.
Usually, the wedge pattern occurs after a strong trend. The polar directions don't vary, only up and down, depending on the type of wedge pattern. Then, the price trend will touch the resistance and support lines at least 5 times, twice on one line and 3 times on the other line. Plus, the volume of prices on the pattern will decrease even more. Also, a reversal signal will confirm a breakout has occurred. If all these conditions are found, the wedge pattern is confirmed.
Although Wedge Patterns tend to give trend reversal indications, sometimes these patterns also show trend continuation signals.
According to research, the wedge pattern has a high win rate. Therefore, the signal quality and accuracy of this pattern are also high. If traders can read the market well, traders can determine entry levels, stop losses, and profit targets when trading.
There are two types of wedge patterns that signal a price reversal:
- Rising Wedge
- Falling Wedge

Question 2
- Explain both types of Wedges and How to identify them in detail. (Screenshots required)
RISING WEDGE
As its name, the Rising Wedge is always pointing up. We can see this pattern clearly in the market graph with the help of a trading tool, trendlines. However, the price trend will be pointing down when the construction of the pattern completes. This pattern can be found in either a Bearish or a Bullish trend.
In fact, we can determine the entry point at the price that crosses the trendline support. Nevertheless, it is alright to wait for one candlestick to form entirely. We do this to ensure the certainty of price movements in what trend. In short, we can open a position when the trend is formed.
We also have to accommodate trading activities with the trending market. Either it is a bearish or bullish trend. It is important to note that traders must follow their trading plan when it comes to profit targets and stop-loss decision-making.
1. Trendlines are not flat
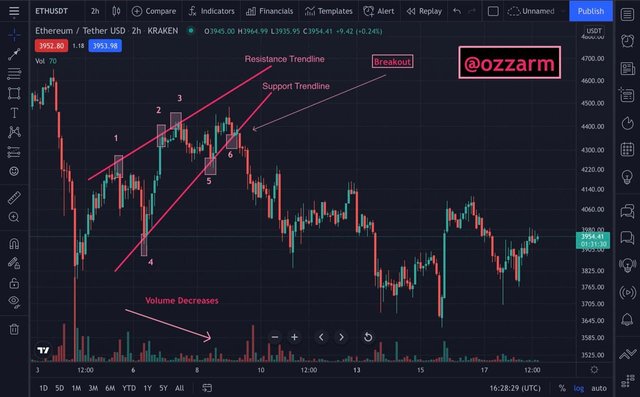
First of all, create resistance and support lines using trendlines. The tool is in the second row on the left. Resistance and support trendlines are slanted. Moreover, the direction of the trendlines will be facing up.
2. Highest and Lowest Price
There should be at least five highest and lowest points touching the trendlines. As it can be seen from the picture above, it has more than 5 touches along with the resistance and support trendlines.
3. Volume Declines
The volume bar chart must be in a decline direction when the pattern is recognized. Unless it is not a rising wedge pattern.
4. Break of Trend Price
Breakout is a crucial moment in the rising wedge to predict the next market. The price in the pattern will break the support trend usually.
FALLING WEDGE
The difference between Rising Wedge and Falling Wedge is in the direction of the pattern and the price. The direction of the Falling Wedge pattern is always downwards, while the price trend will point upwards when a breakout occurs.
When a new market is formed, traders can determine their trading activities. At the time of the Bearish Trend, traders will choose to sell. On the other hand, traders will choose to buy during a bullish trend.
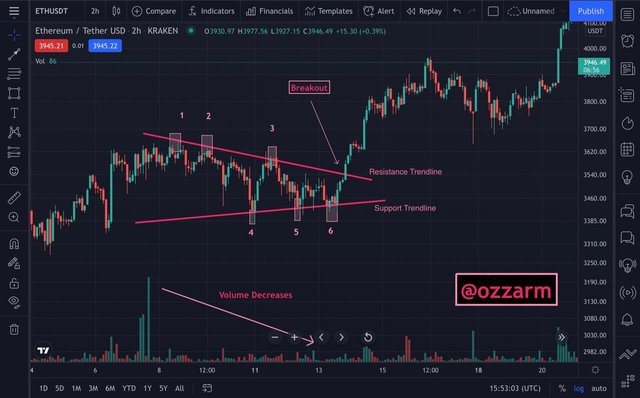
1. Trendlines are not flat
Use the trendlines tool to draw resistance and support lines. Resistance and support trendlines are slopes. Then, make sure that the trendlines are facing downwards.
2. Highest and Lowest Price
My example of the Falling Wedge has more than 5 touches along with the resistance and support trendlines. Thus, it can be a Falling Wedge after confirming the other steps.
3. Volume Declines
Again, the volume of the price is declining.
4. Break of Trend Price
The trending price in the pattern will break the resistance trend at the end of the pattern.
Overall, if all the steps are satisfied, the wedge patterns are confirmed.

Question 3
- Do the breakout of these Wedge Patterns produce False Signals sometimes? If yes, then Explain how to filter out these False signals.
FALSE SIGNAL IN WEDGE PATTERNS
As I learned in crypto classes, there are no chart patterns and indicators 100% accurate to establish market signals. Likewise, the Wedge Patterns sometimes display a false signal. A false signal is a situation where the price formed on the market graph does not satisfy the prediction.
In this pattern, the last thing that becomes the concern for our analysis is the breakout. When the price intersects the trendlines, and the price halted to continue the trending market in the middle of the movement, then change the direction. It is when the wedge patterns generate false signals.
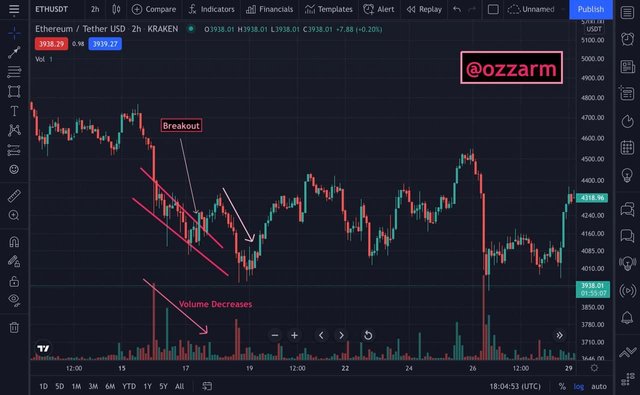
The picture above shows that the price is pretending like it is forming a bullish trend after the breakout. Yet, the price drops and could not create a new market in the middle of the price movement.
Furthermore, we can also filter out false signals that appear in wedge patterns by combining this pattern with other indicators such as RSI.
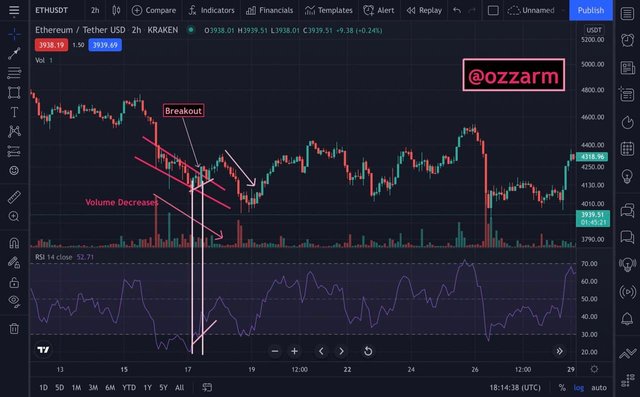
Since the price trend indicates a trend reversal to be an uptrend, we can confirm this signal by checking the Bullish Divergence. First, we need to set RSI as our indicator. Then, we draw a line on the Lower Low in the price and Higher Low on the indicator chart. If the pattern produces a divergence, then the reversal signal in the wedge patterns is correct. However, the pattern that emerged on the price and indicator is not a divergence. All in all, the signal generated by the wedge pattern is false.

Question 4
Show full trade setup using this pattern for both types of Wedges.( Entry Point, Take Profit, Stop Loss, Breakout)
RISING WEDGE SETUP
Now I will show a full trade setup using the Rising Wedge. Before further explanation, I will first enter into the ETH/USDT coin cryptocurrency market. I suggest implementing the steps in identifying the Rising Wedge as described earlier. Thus, we can easily find this pattern in the market.
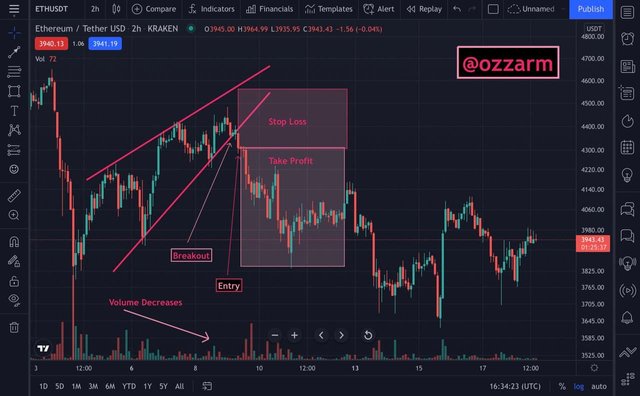
It can be seen from the picture above that the Rising Wedge is giving a signal for the continuation of the bearish trend. There is a bit of equivocation movement in the formation of green candlesticks, at the breakout trend to be exact. It should be a red candlestick since it is a bearish trend. At this uncertain time, more promising for us to wait for the next candlestick to assemble. In consequence, the signal that appears will be more convincing and accurate.
The red candlestick developed the next moment. The trend is quite compelling because it creates a new lowest point than the previous price. We can determine the entry point on the following candlestick starting to appear. The entry point is when the price is 4300 USDT.
In a downtrend, traders will be in a buy position. As long as the price trend still shows a downtrend and does not back to the entry time, traders can optimize their profits. Traders can stop at the price is the same as when the breakout is created on the pattern, or anywhere in between as the mark I made as in the picture above.
FALLING WEDGE SETUP
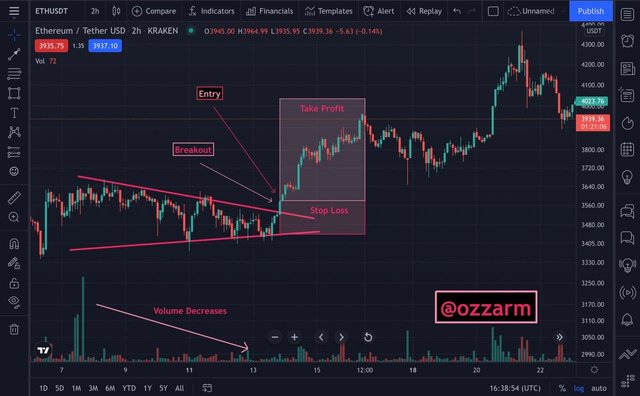
I also use the same cryptocurrency ETH/USDT for the Falling Wedge trade setup. The entry point for this setup is when the price is approximately 3560 USDT. Coinciding with the second green candlestick appears after the breakout.
Traders should be in the open position when the price crosses the trendline resistance. However, I want to ensure the signal by waiting for the green candlestick to form perfectly.
In a bullish trend, traders will be in a sell position. It is the opposite of the rising wedge trade setup, as long as the price trend still shows an uptrend, traders can take profits according to their target. The stop loss point for traders during the falling wedge setup is below the price before the entry point. As in the picture above.

Question 5
Conclusion
CONCLUSION
Wedge Patterns are very similar to Triangle Patterns. The difference between the patterns is that the resistance and support trendlines in wedge patterns are uneven. Both are in a tilted position. We can analyze the upcoming market by looking at this pattern. Frequently, the market signal that can be seen from wedge patterns is a reversal signal. However, it could also be a continuation call. Wedge Pattern has two categories, namely Rising Wedge and Falling Wedge.
The Rising Wedge pattern is always pointing up while the Falling Wedge is pointing down. Apart from that, there are other steps to help us to identify Wedge Patterns. For example, volume, highest and lowest price touching trendlines, and breakouts. Although research proves that this pattern has a high win rate, the signal given by this pattern is always 100% correct. Traders can combine this pattern with other indicators such as RSI to check the certainty and accuracy of market signals. Plus, we can also determine the right trade setup for each pattern by studying wedge patterns.

Hello Professor!
I am sorry if I offend you. But, I will post this as I do not understand why I was not eligible last week. Please explain me if I am not eligible for this week homework. Hope your success!

Thank you to all professors who enlighten all the students in Steemit Crypto Academy through their guidance and knowledge. Your support always helps us present and future.
Signed.
@ozzarm
