[REPOST] Rectangle Pattern - Crypto Academy / S5W4 - Homework Post for @sachin08
Here is the initial post and the first repost
This article is my homework elaboration for Beginner Level in Steemit Crypto Academy. Specifically, in the class of professor @sachin08 regarding TRADING USING RECTANGLE PATTERN.

Question 1
Explain Rectangle Pattern in your own word.
RECTANGLE PATTERN
To begin with, I want to highlight that market price movements are very dynamic and busy. Moreover, most of the cryptocurrencies market has high volatility. Therefore, it is expected for anyone who checks the marketplace to see price charts climbing and falling quickly. Especially for those who want to analyze price movements, they must apprehend the market. One way to know the market is by being able to read patterns on a market graph.
The rectangle pattern is one of the chart patterns in the cryptocurrencies market. It is a technique to read price movements on market charts using rectangular shapes. However, this rectangle pattern can only work on the market, where it is in a consolidation situation. Consolidation means both buyers and sellers in the market are equally strong. Hence, when we draw a rectangle pattern on the graph, we see a flat line resistance and support levels. In other words, the price only moves between resistance and support levels and fails to break through the line.
Besides, it is much easier to predict price movements if the trend is only up and down since the stronger one who conquered the marketplace is clear. The challenge is in reading the market when the price is in the range phase or sideways because no one knows the direction of the next market movement. It is difficult for us to determine the price tendency. Will the price create a new market or continue the previous market before consolidation occurs. A rectangle pattern can help us predict the next direction of the market price.
Moreover, two signals can be found by looking at the rectangle pattern, either bullish phase or bearish phase. For the former, is when the price chart breaks the resistance line, the price may grow. For the latter, is when the price tendency crosses the support line, the price expected to drop. Nonetheless, the determination of the upcoming price depends on the psychology of the Buyers and Sellers.
Question 2
How to identify Rectangles. Explain with Screenshots.
IDENTIFYING RECTANGLES
We can identify rectangle patterns by looking at prices moving horizontally, created sideways, or trendless in the marketplace. Usually, the ranging phase occurs after or before a new market shaped, either uptrend or downtrend. Yet, I will explain some ways to identify rectangles based on my understanding and research as follows:
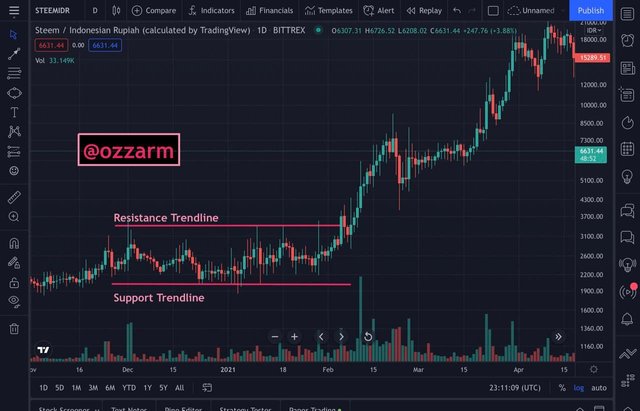
1. Resistance and Support Trendlines
After determining the consolidation phase between demands and supplies in the market, we can use trendlines, a trading tool, to draw resistance and support lines. It is rectangle patterns when we can find more than two swings high and swings low at the same level on the two trendlines. In other words, if the price line moves back and forth between the resistance and support levels, creating flat resistance and support trendlines, then the pattern is rectangles.
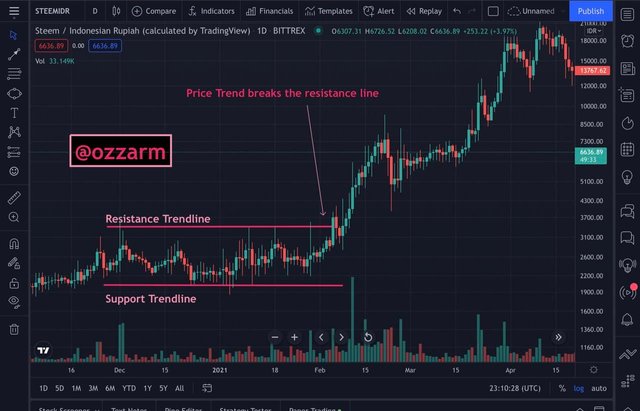
2. Price Movement
After we decided on the support and resistance levels, we have to take a closer look at the price movement. The price graph that is always moving up and down can predict the next trend. If the price crosses the resistance line, a bullish trend may be created on the market chart. Vice versa, if the price trend breaks the support line, there is a potential that a downtrend will be shaped.
3. Low Volatility
Low market volatility also indicates that the market is in a range trend because prices are moving steadily. Additionally, we can use indicators such as the Donchian Channel or Bollinger Band to see the highs and lows of market volatility. If the distance between the resistance and support levels is too far, the market volatility is high. Vice versa, if the distance between the resistance and support levels is nearer, then the market volatility is low. During the market has low volatility, we can draw resistance and support trendlines to identify rectangles. As long as the price movement does not break the two trendlines, then the rectangle pattern is confirmed.
Question 3
Can we use indicators with this pattern to get accurate results? Explain with Screenshots.
INDICATORS AND RECTANGLE PATTERN
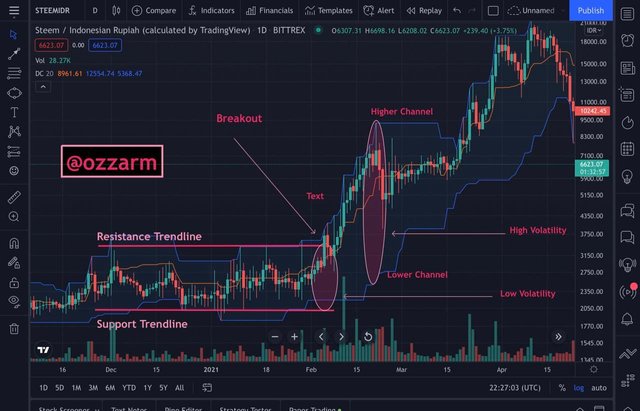
As mentioned above, we can combine indicators with rectangle patterns. As a result, we can get high-quality and accurate analysis results. For example, the usage of the Donchian Channel indicator can help us determine markets that have low volatility. On the Donchian Channel, the indicator consists of three lines, namely the Higher Channel, Middle Channel, and Lower Channel.
As we want to analyze the low volatility in the market, we have to look at the distance between the Higher Channel and the Lower Channel. If the distance between the two is closer, the volatility is low and the opposite. Since rectangle patterns appear when the market is stable, we must pay attention to the market chart that has low volatility. That way, we can analyze price tendencies. As in the image below:
As the price trend crosses the rectangle top or resistance line, the market forms an uptrend. In this market condition, the action we have to take is to buy crypto assets.
It is important to note that we should use a timeframe that matches our trading strategy. According to research, timeframes that are set more than 4 hours are good for novice traders who trade every day. Therefore, I customize to a day timeframe to help me analyze the market movement. If I set it on 15 minutes timeframe, I would be too nervous to determine my entry point since the graph will change every 15 minutes.
Question 4
Explain Rectangle Tops and Rectangle Bottoms in your own words with Screenshots of both patterns.
RECTANGLE TOPS AND RECTANGLE BOTTOMS
There are two types of rectangle patterns. These rectangle patterns show a trend continuation. The first one is rectangle top and the second is rectangle bottom. Rectangle Top is a rectangle pattern that is shaped after a bullish trend. Furthermore, when in this sideways condition, price movements can be predicted to pass the resistance level. That way, the previous bullish trend will continue.
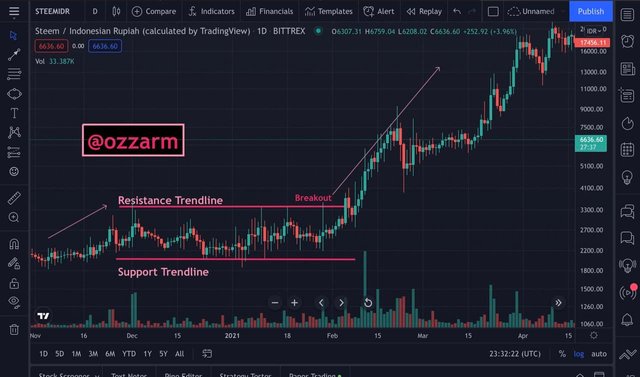
As it can be seen that before the consolidation market, the trend is in an uptrend. Then, the price moves and created more than two swings between the resistance and support level. Hence, the trend breaks the resistance. Consequently, the bullish trend continues to shape the market. All in all, the rectangle formed is a rectangle top.
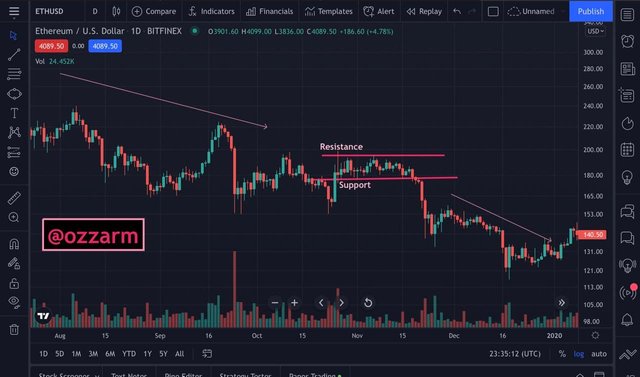
In contrast, a rectangle bottom is formed in a bearish trend. The picture indicates that the rectangle pattern happened on a sideways trend and there are more than two swings in the meantime. After that, the price trend crosses the support level. Subsequently, the market continues the bearish trend.
Question 5
Show full trade setup using this pattern for both trends. ( Entry Point, Take Profit, Stop Loss, Breakout)
PRACTICE
Buy Setup
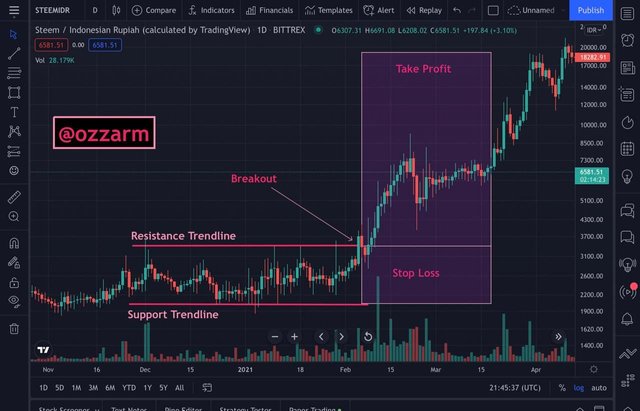
Buy trade setup is done when the breakout occurs at the resistance because we can predict that the price will increase creating a bullish trend. Based on the results of the analysis, the entry point is on the breakout chart which has just crossed the resistance line. When traders are in open positions, they can take profits as long as the price continues to cross the resistance line. Unlike stop-loss point, traders can exit when the price hits resistance and before it hits the support line.
Sell Setup
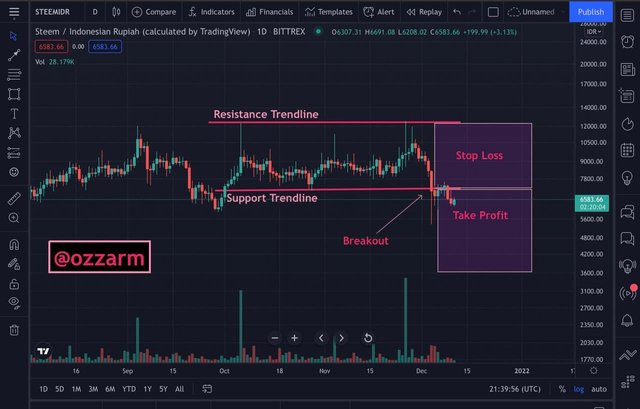
On the other hand, if the market creates a bearish trend, then we must open a position to sell. The entry point is when the price trend breaks the support line. As long as the price does not cross the support line, then it is time to take profit. Meanwhile, if the price trend across the support line, it is time to stop loss.
Question 6
Conclusion.
CONCLUSION
Again, it is challenging to analyze market movements when the market is in a ranging phase. The ranging phase means the zigzag price chart moves sideways so that the next market movement has two different possibilities. First, the market may continue the trend before sideways appear, or the trend will reverse and create a new market.
In this class, we learned that there is a way to read market movements when consolidation occurs by using a rectangle pattern. Vital, we can use the trendlines tool and see low market volatility to identify rectangle patterns. In trading, the rectangle pattern strategy can also be combined with indicators such as the Donchian Channel, Bollinger Bands, and others.
In addition, rectangle patterns are divided into two types, namely rectangle top, and rectangle bottom. It indicates the trend continuation. Rectangle top is the occurrence of a breakout at the resistance level where we can predict the next market is an uptrend and before the rectangle appears, the market is in a bullish trend. Rectangle bottom is the occurrence of a breakout at the support level where we can see that the next market that may be formed is a bearish trend and before the rectangle shows, the previous market is also downtrend.
Thank you to all professors who enlighten all the students in Steemit Crypto Academy through their guidance and knowledge. Your support always helps us present and future.
Signed.
@ozzarm