Fear and Greed Index - Crypto Academy / S4W5 - Homework Post for @wahyunahrul
1). Explain why emotional states can affect cryptocurrency price movements?
Although cryptocurrencies are revolutionary tools to change the financial system, they are still tools made for people that people use. Emotions are inevitable when the word human is involved. Professional or not, every person who trades crypto can inevitably add their emotions to this work, no matter how much technical and fundamental analysis they do.
The price of crypto is directly proportional to supply and demand. As the demand increases, the price of that coin increases, and as the supply increases, the price decreases. It is people who create this supply and demand. If the price of a coin is on the rise, people will want to buy it for profit. When the price drops, they will fearfully want to get this coin out of their hands.
As soon as I read this question, the first example that came to my mind was the Dogecoin example. As it is known, Dogecoin was a meme coin and was not taken seriously by most people. But everything changed with a tweet by Elon Musk in February 2021. Since this date, there has been a serious increase in Dogecoin prices. The reason for this actually coincides with the subject of today's homework. People thought that the price would increase with this tweet and wanted to buy this coin. For this reason, the demand for this coin increased and the price naturally increased.
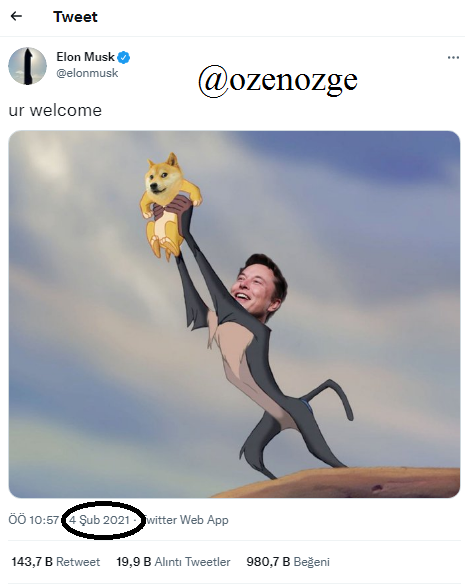
We can easily see from the chart below that the sudden increase in Dogecoin prices came to the same time as Elon Musk's famous tweet.
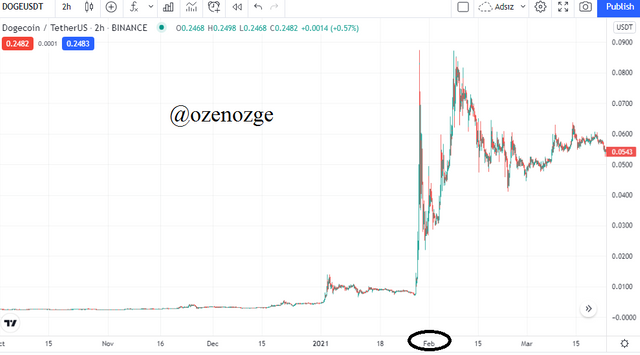
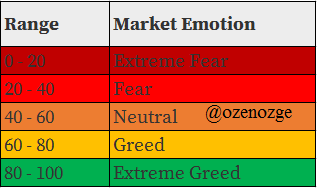
By looking at this indicator in the table below, it can be understood that the market is in the phase of fear or greed. The Fear and Greed Indicator is only measured for Bitcoin. However, if measured for Dogecoin, this indicator would most likely be in the Greed (60-100) region.

2). In your personal opinion, is the Fear and Greed Index a good indicator of the market's emotional state? if not, try to give reasons and examples of other similar indicators for comparison.
Before answering this question, I would like to talk about the Fear and Greed Indicator. This indicator is an indicator that measures the emotional side of investors in line with the movements in the market. In this respect, it is similar to the FOMO indicator. This indicator is calculated daily at alternative.me. It is quite simple to understand and use compared to other indicators.
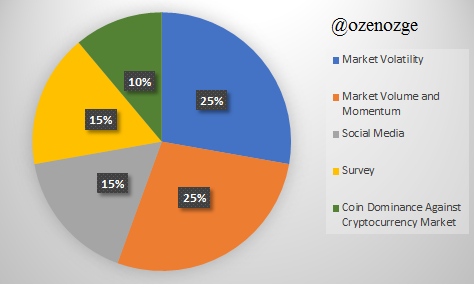
The creators of the indicator make use of 6 different components when calculating this indicator.
Volatility
Volatility is actually an important parameter to consider when making an analysis. High volatility means that the price can easily rise and fall. This is a situation that worries investors. 25% of the Fear and Greed indicator is calculated by taking this value.
Market Volume and Momentum
Looking at the market, the majority of buyers is a sign of an increase in prices. If sellers are in the majority, it is predicted that prices will decrease this time. In other words, Market Volume and Momentum are also important for this indicator. The average price of Bitcoin in 30 and 90 days is compared with the data on the day the indicator was calculated. These values constitute 25% of our indicator.
Social Media
Values such as volume volatility are already calculated and relatively easy to calculate. One of the most important differences that distinguish this indicator from other indicators is that it also considers social media. Of course, the importance of social media in the crypto markets today cannot be discussed.
According to the intensity of discussion of Bitcoin on social media sites such as Twitter and Reddit, it can be determined that the market is in fear or Greedy phase. While calculating the index, the rate of social media was determined as 15 percent.
Surveys
Polls are very important in political circles today. It gives quite an idea about people's ideas about a subject. For this reason, its importance is undeniable. For this purpose, the creators of the indicator also use the survey while calculating the indicator. They included them in the indicator calculations using the data they received from strawpoll.com. According to the information they give, around 2000-3000 questionnaires are filled daily. The survey section constitutes 15% of the indicator.
Dominance
It is possible to divide the market into two as Bitcoin and altcoins. Since Bitcoin was the first cryptocurrency, it is both the most known and the highest-priced coin. Sometimes Bitcoin performs better in the market, and sometimes altcoins perform better. In fact, a concept called altcoin season has emerged from this point of view. If we are in altcoin season, Bitcoin's dominance is low and we are in a fear phase for Bitcoin. If we are not in altcoin season, Bitcoin has performed better and investors tend to buy Bitcoin. So it is in the Greed phase.
Trends
Here, google searches are based on and it is examined whether people tend to buy or sell Bitcoin. But the search is not limited to "Bitcoin" only. Searches with terms related to Bitcoin were also taken into account. Trends contribute 10% when calculating the indicator.
In my personal opinion, creating an index on this subject is a very good thing. We know that one of the most important factors that direct prices in the crypto world are the decisions made by people. While making these decisions, their emotions are definitely involved. We are used to mathematizing everything in technical analysis. But of course, turning emotion into a mathematical index is not an easy thing. We can also have an idea of what the market trend is, but this will perhaps be limited to our own small circle. But with this index, we reach global information.
Of course, it is very normal to have a margin of error. But overall I think this indicator is successful. First of all, one of its best features is that it is not calculated based on a single component. It is calculated in components such as market volatility, market volume, and momentum, social media, surveys, coin dominance. These components are also important individually and they are already driving the market.
Although my opinions about this indicator are positive, there are also aspects that I think are negative.
I think the percentage given to the survey section is high. Because these surveys reflect the views of a very small group of people and maybe misleading. Another negative feature is that we are exposed to bots a lot on social media. Especially those who want to do perception management can change the orientation in social media with bot accounts. It is also insufficient to have only Twitter and Reddit as social media. Today, cryptocurrencies are seriously discussed on channels such as Telegram Discord.
3). Give your personal opinion on what data should be added to the Fear and Greed Indicator.
In the previous question, the data used when calculating this indicator were given. I would like to reiterate these data and their percentages. The data and percentages used are shown in the chart below. Here we see that Volatility, Market Momentum/Volume, Social Media, Surveys, and Dominance are used when calculating the value of this indicator.
- As I mentioned in the previous question, it may be useful to change the percentages of these data. Especially the survey is a high rate in my opinion. Or, the scope of the survey can be increased even if the survey percentage will not be changed. For example, instead of a 2000-person survey, a 20000-person survey.
- In addition to Twitter and Reddit, Telegram and Discord data can also be added to social media data.
- Apart from that, one of the biggest disadvantages of this indicator is that this indicator is only measured on a daily basis. Adding data for different time periods can make this indicator more useful. Such as hourly, yearly, etc.
- The most important item is that this indicator is calculated only for Bitcoin. But now there are more than 12 thousand tokens on the market. It may not be possible to calculate this indicator for all of them, but at least for the top 10 coins/tokens, this indicator can be calculated.
4). Do a technical analysis for 2 to 3 days (maybe more) using the Feer and Greed Index and the help of other indicators. Show how you made the decision to enter the cryptocurrency market and explain the results of your trade (Screenshot Required)
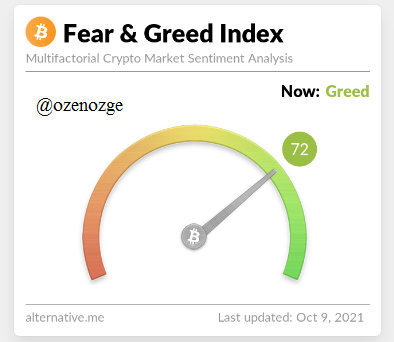
The day I wrote this article, the Fear and Greed Index was 72. So as of today, we are in the Greed phase. In other words today people tend to buy Bitcoin. So this shows us that the prices are higher than they should be (overbought). It can be profitable to sell from this point.
Bitcoin sell signal on the indicator. However, as we have repeatedly underlined in our previous lectures, a buying and selling decision should not be made based on a single indicator. We need to verify this using another indicator. As the indicator I will use, it will be the RSI that I often prefer when trading. The reason I chose the RSI indicator is that it actually shows us the overbought and oversold regions.
Logically, I likened it to the fear and greed indicator because it shows us that there is too much purchase or too many sales in certain time periods.
I have some BTC in my Binance account. First, I opened the 5-minute BTCTRY chart from Tradingview and added the RSI indicator to the chart. I have some BTC in my Binance account. First, I opened the 5-minute BTCTRY chart from Tradingview and added the RSI indicator to the chart.
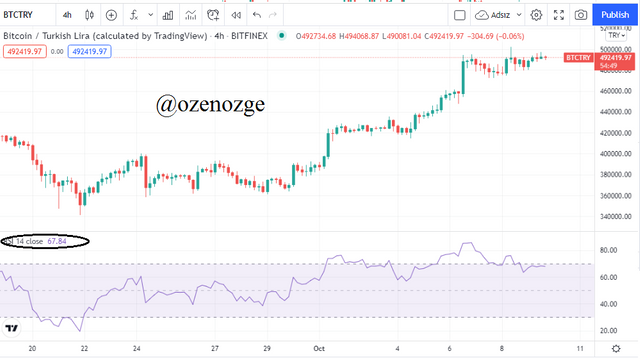
The RSI was 67, so it's exactly in the overbought zone. I placed a sell order because the two indicators confirmed each other. I sold 0.05 BTC selling from 489590.
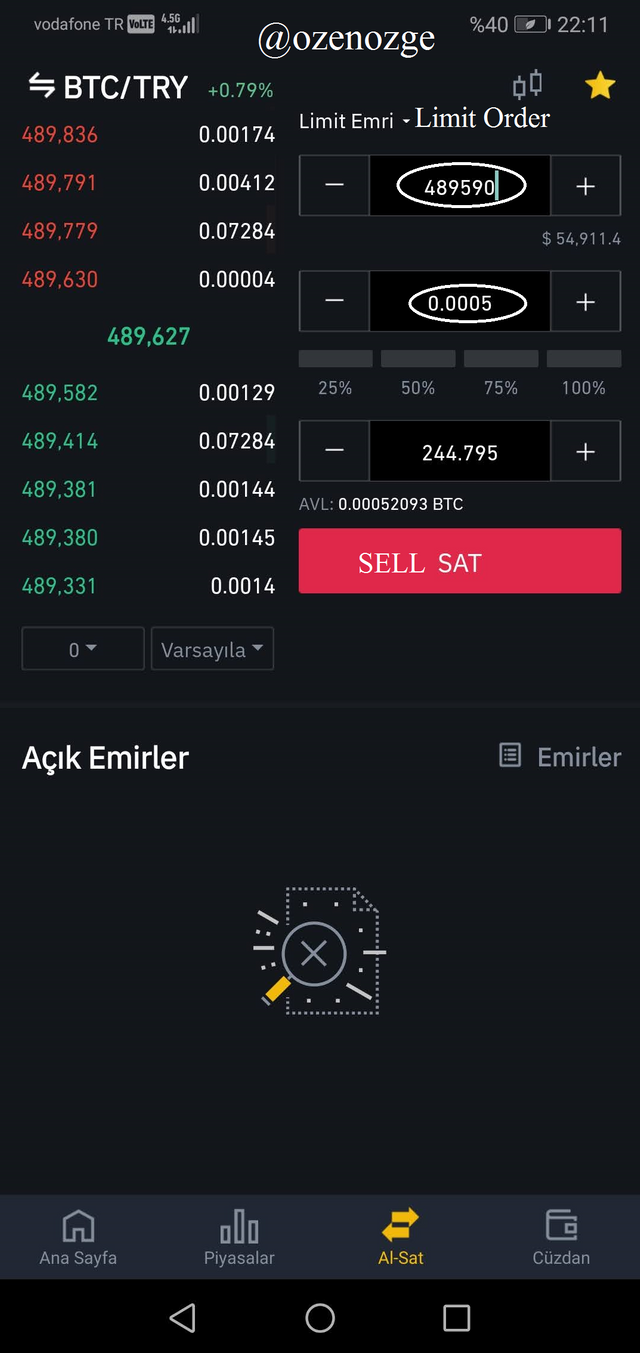
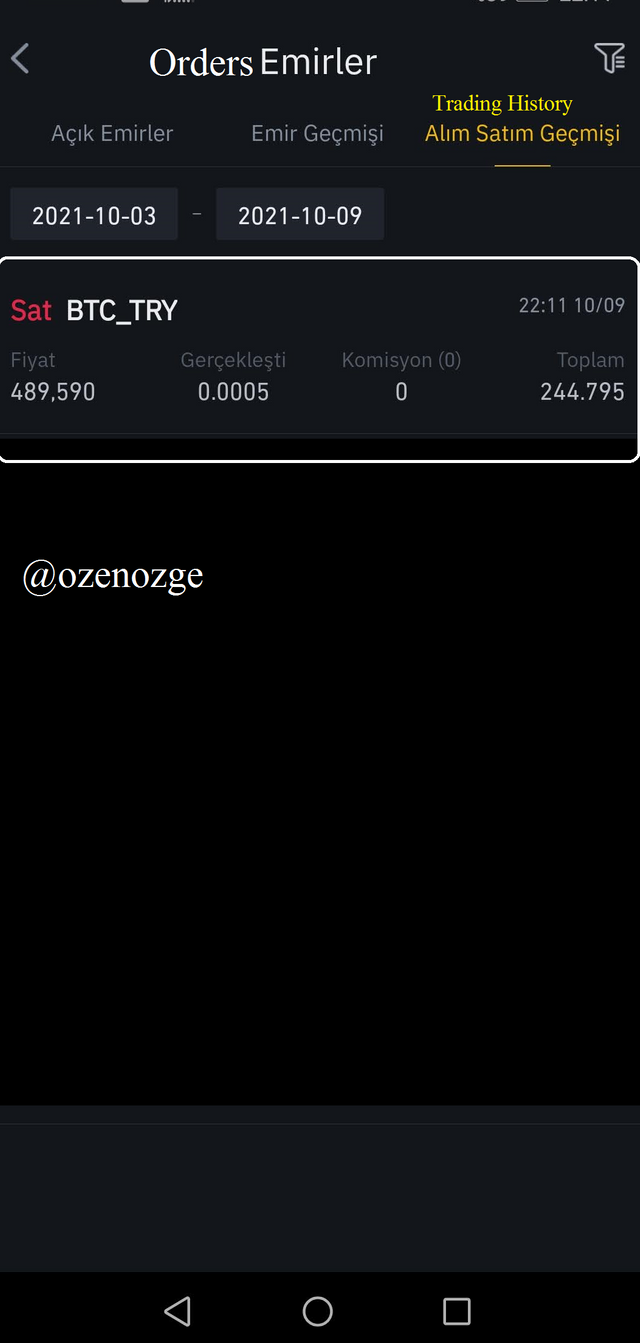
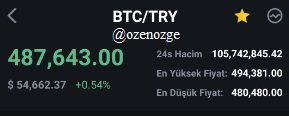
After I made the trade, the price of Bitcoin dropped to 487643. Of course, this is a very short time, but at least in the short term, I think I made a profitable sale.
5). Conclusion.
Looking at the market today, there are more than a hundred indicators for cryptocurrencies. Looking at these indicators, almost all of them are easy to calculate mathematically. However, when we look at the Fear and Greed indicator, it contains certain components that are quite complicated to calculate mathematically. It is the indicator that determines whether people are worried about the course of the market or whether they trust the market and want to buy. For this, data such as social media data, surveys, volume, volatility, trend, and dominance were compiled and determined. If this indicator shows greed, investors tend to buy coins, that is, they are in the overbought zone. In Fear, on the other hand, investors tend to sell and the coin is in the oversold zone.
CC:@wahyunahrul
Excellent work
Thank you :)