[Candlestick Patterns] - Steemit Crypto Academy Season 4 - Homework Post for Task 10
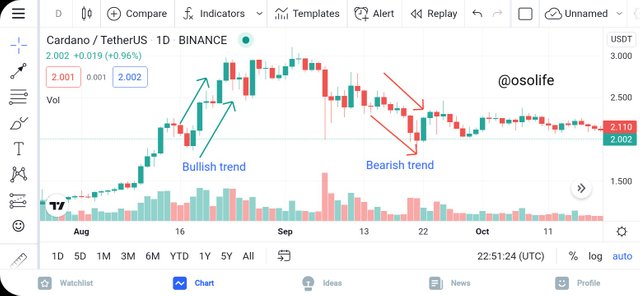
1a) EXPLAIN THE JAPANESE CANDLESTICK CHART?(Original screenshot required)
b) IN YOUR OWN WORDS, EXPLAIN WHY THE JAPANESE CANDLESTICK CHART IS THE MOST USED IN THE FINICIAL MARKET
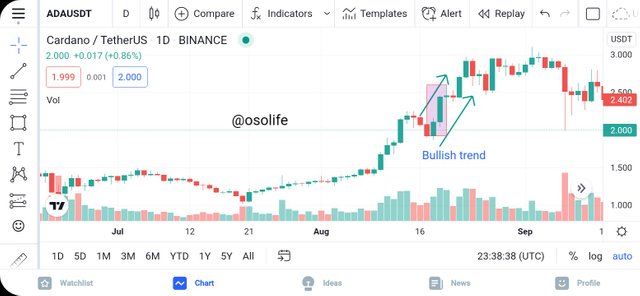
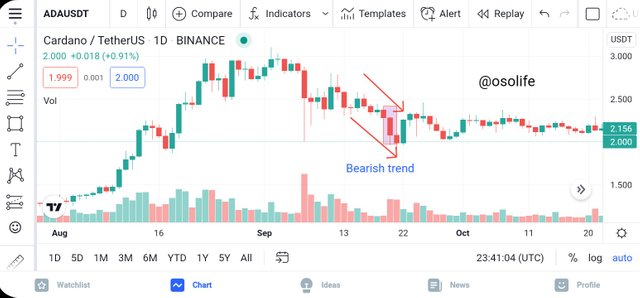
c) DESCRIBE A BULLISH AND A BEARISH CANDLE. ALSO, EXPLAIN ITS ANATOMY. (Original screenshot required)
Japanese candlestick is a type of candlestick chart which traders makes use of it to make analysis on market movement and actions on chart. The japanese candlestick was actually established by a rice trader called Munehisa Homma and it was published by a broker whose name was Steve Nison. Japanese candlestick chart was built for traders to under the market movement easily, due to the colour of it. This can make traders to take action, it could be by , whether to buy or sell crypto.
The Japanese candlestick chart give traders full or detailed data and a specific information on jow market moves, meanwhile traders usually make use of it because of its easy method to indicate and operate too. Using the Japanese candlestick chart, a trader can predict what the market price will result or what result the market price will give in future.
This type of candlestick indicates the opening, closing, the low and high in a given time. This means that whenever the close gets more higher than the open price, thos will tell us that the market is in a bullish trend and the body of the candlestick will turn into green colour or white as well. Meanwhile, whenever the close gets lower than the open price, this will tell us that the market is in a bearish trend and the body of the candlestick will turn into green colour.
Japanese candlestick chart if often used in finicial market because of the following ÷
It is very easy to understand, when give it a look, you will understand what the markets tells and very easy to make use of.
Traders makes use of japanese candlestick chart to know or analyze market movement. This could be, checking if it in bullish or bearish movement, i.e to know whether buyers have taking over the market or maybe seller have taken over the market.
Japanese candlestick like i said earlier, gives traders detailed information about price and movement of market.
With the help of japanese candlestick, traders can make decision on when to purchase tokens or asset and also know when to sell cryptos.
BULLISH CANDLESTICK
A bullish candlestick shows the positive increase in market price in crypto charts which simply indicates that the market is in uptrend move. The bullish candlestick also tells traders that buyers are in full control of the market. Bullish trend always occur when traders purchases on a particular asset. When the candlestick turns to be green or white, it means that shareholders are expecting the marker to rise. It permits candlesticks like high and low, open and close etc, which i will explain in bullish anatomy. In short, bullish candlestick shows the positive motion in the market chart.
BULLISH ANATOMY
Explaining the bullish anatomy÷
The open÷ The open shows or indicates the initial price on a crypto asset in a given period of time. This is often seen at the lower level of the bullish candlestick.
The close÷ The close shows or indicates the finishing price on a crypto asset in a period of time. This is often seen at the higher level of bullish candlestick..
High÷ It shows or indicates the topmost crypto assets that was bought in a given period of time.
Low÷ it shows ot indicates thr lowermost crupto assets that was bought in a given period of time.
BEARISH CANDLESTICK
A bearish candlestick shows the negative decrease in market price in crypto charts which simply indicates that the market is in dwontrend move. The bearish candlestick also tells traders that sellers are in full control of the market. Bearish trend always occur when traders withdraws or sell of their crypto asset. When the candlestick turns to be red or black, it means that shareholders are expecting the marker to fall. In short, bearish candlestick shows the negative motion in the market chart.
BEARISH ANATOMY
Explaining the bearish anatomy÷
The open÷ The open shows or indicates the initial price on a crypto asset in a given period of time. This is often seen at the higher level of the bullish candlestick.
The close÷ The close shows or indicates the finishing price on a crypto asset in a period of time. This is often seen at the lower level of bullish candlestick..
High÷ It shows or indicates the topmost crypto assets that was bought in a given period of time.
Low÷ it shows ot indicates thr lowermost crupto assets that was bought in a given period of time.
CONCLUSION
Japanese candlestick is a kind of candlestick traders need to make use of, because is easy to understand or operate. I reall appreciate for lecture, i was able to understand a lot about Japanese candlestick.
THANKS FOR READING
.jpeg)
.jpg)
#club5050 😀