Steemit Crypto Academy | Season 3 | Week 6 - Homework Post for @asaj. Vortex Indicator Strategy
Thanks to steemit and the professors for every time knowledge given to we the users
1 explain the vortex indicator and how it is calculated
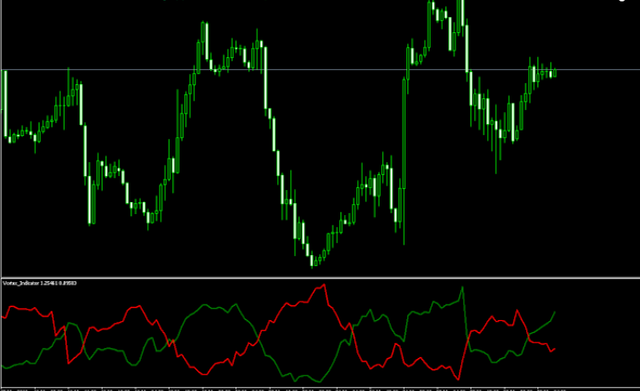
Vortex indicator (VI) is an indicator that made up of two lines which is an uptrend line (VI+) and a downtrend line (VI-). These lines are colored green and red respectively. Vortex indicator's usefulness is to point trend change and confirm the current trends.
VI was designed by Douglas Siepman and Etienne Botes, they introduced the concept in 2009 edition of Technical Analysis of Stocks & Commodities. They are on just two trendlines: VI+ and VI-
Calculation of VTX can be split to 3 parts. Firstly, compute both the positive & negative trend movements but it based on the lows and highs of the last two periods. The Positive trend physical motion is the amount of space from the current high to the former low. The further the current high is from the former low, the more the trend move positively. While the negative trend movement is the amount of space covered from the current low to the previous high. The forward the current low is from the previous high, is the more negative the trend movement would be. But these periodic values summed based on the settings of the indicator, which is most time 14 periods.
The second part of the calculations would include the True Range, which was made by Welles Wilder. This indicator make use of current high, the current low and previous close to measure volatility.
The third make the positive and negative trend movements normal when splitting them by the True Range. In result, VI shows the adjusted positive volatility, trend motion and volatility adjusted negative trend movement. So the outcome makes two indicators
The calculation goes thus:
The Positive with negative trend movement is:
+VM is High minus Prior Low
-VM is Low minus Prior High
+VM14 is 14-period addition of +VM
-VM14 is 14-period addiction of -VM
While true Range (TR) is the greatest of:
The current High less current Low. Current High less prior Close (absolute value)
Current Low less previous Close (absolute value)
TR14 = 14-period Sum of TR
To put the positive and negative trend movements in normal:
+VI14 = +VM14/TR14
-VI14 = -VM14/TR14
2 If vortex indicator is reliable?
For newbies in trading or newbies in Votex indicator, the real-life trading is advised before concluding if it's reliable or not.
Vortex indicator is reliable but to be reliable, make use of length 7 or length 14 for quick and correct indication and in market that fluctuate, we should make use of 28 or 30 lengths because it decreases the margin of the mistake because of the fluctuations and volatility in market price.
Since it's an Indicator, what Indicator do is help trading analyze the asset before trader purchase and sell the assets. To know if the Indicator is reliable or it needed to work on for some time to be aware or notice there is mistakes in the trading or not.
Traders needs to take note that if the blue line crosses the orange line that's a buy signal because that's when the market goes bullish in the uptrend. And whenever the orange line cross Blue line, it is a signal to sell beaus the market is going in the bearish trend.
3 How is vortex indicator added to a chart and recommend
As professor @asaj explained to us, the same way I'll explain mine too but I may not be perfect like him
- Firstly I go to tradeview.com where I laughed a chart 📈
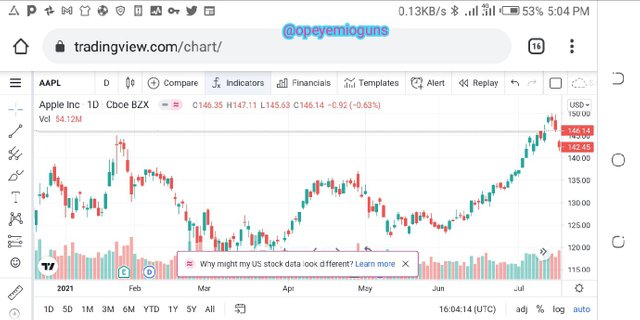
i made Screenshot at tradingview.com and edited it with imark
- After the chart 📈 I clicked on indicator above the chart
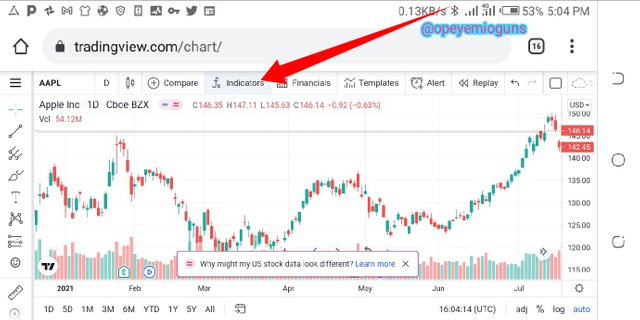
i made Screenshot at tradingview.com and edited it with imark
- So I searched for vortex
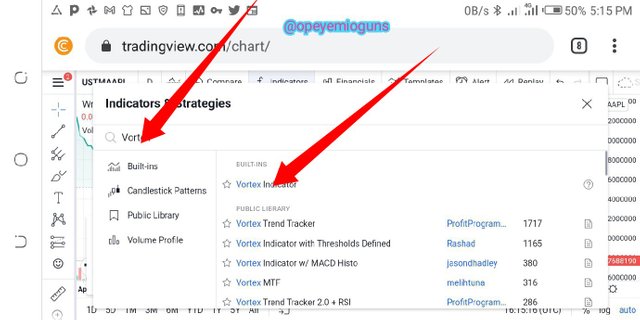
i made Screenshot at tradingview.com and edited it with imark
- This is the result, which means the indicator has been added
i made Screenshot at tradingview.com and edited it with imark
The recommend parameters
I clicked on iv to get options
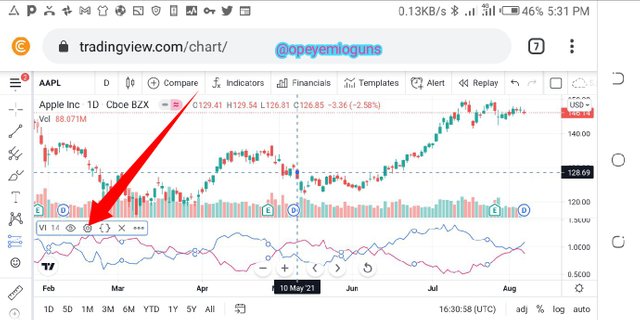
i made Screenshot at tradingview.com and edited it with imark
- After that I choose style and selected colour for VI+ and VI-
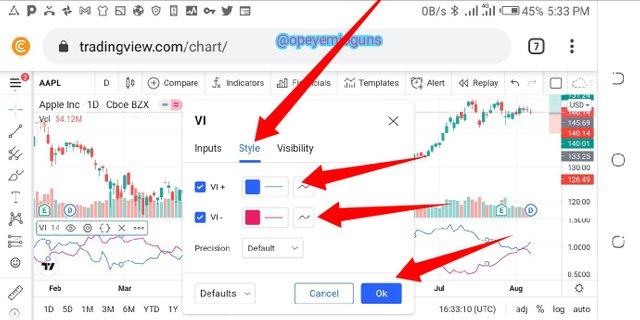
i made Screenshot at tradingview.com and edited it with imark
- After then I choose selected input and then selected lenght side, the indicator time frame
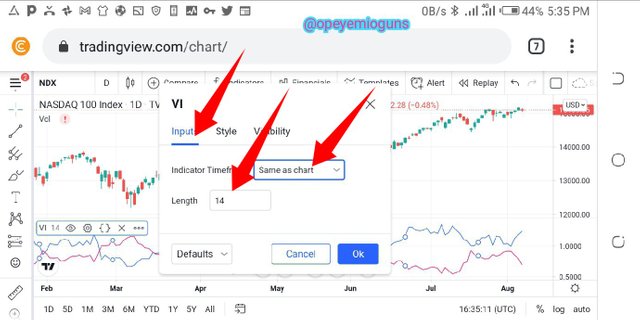
i made Screenshot at tradingview.com and edited it with imark
- After that, I set the visibility as default but in my screenshot, I added arrows to where changes can be made
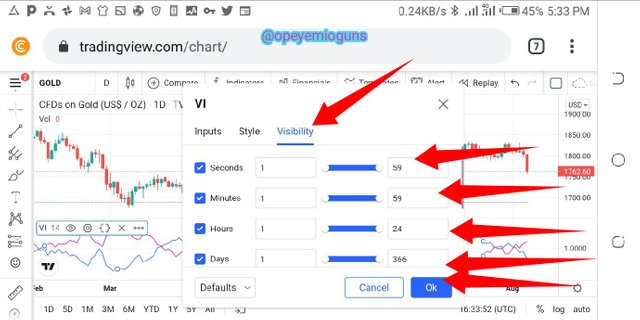
i made Screenshot at tradingview.com and edited it with imark
- In the input, time frame can be set, it depend on condition but I left it in default.
i made Screenshot at tradingview.com and edited it with imark
- The visibility can also be set but I left it at default but I put arrows where settings can be made in KY screenshot
i made Screenshot at tradingview.com and edited it with imark
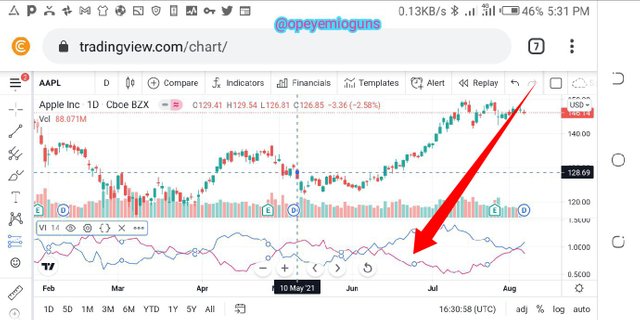
4 Concept of indicator divergence
Divergence is what occurred when the chart and the indicators goes in different directions, the opposite directions to be precise. We have two types of Divergence in Vortex Indicators. They are Bearish Divergence and Bullish.
Bullish divergence occurs when the Blue line ( VI+ trendline) goes higher high but the chart price movement goes to Lower high. It is indicate that as purchasing signal for the traders.
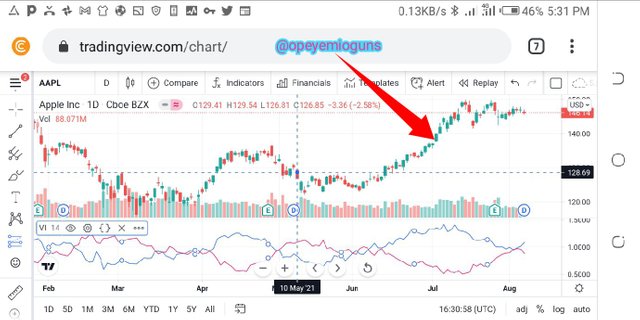
i made Screenshot at tradingview.com and edited it with imark
According to professor @asaj explanation, the VI+ is the blue line which shows or indicate the positive movement of the market.
VI- is the orange line that shows or indicate the negative movements of the market.
Bullish divergence occurs when the Blue line ( VI+ trendline) goes higher high but the chart price movement goes to Lower high. It indicate that as purchasing signal for the traders.
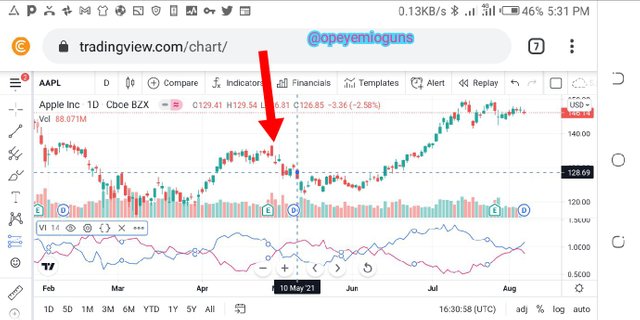
i made Screenshot at tradingview.com and edited it with imark
5 Buy any two cryptocurrency with VI signal
I just opened my wallet on binance and then I get the buy and sell done
I sold DOT and I bought XRP
- DOT
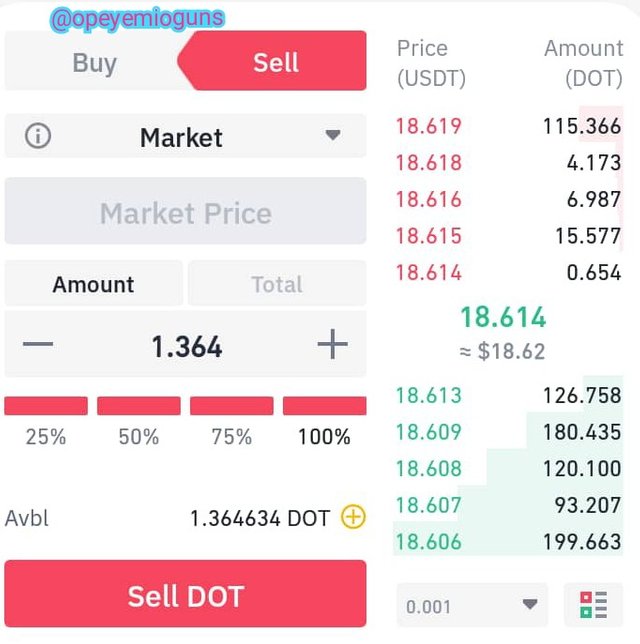
i made this screenshot on binance and edited it with imarkup
- XRP
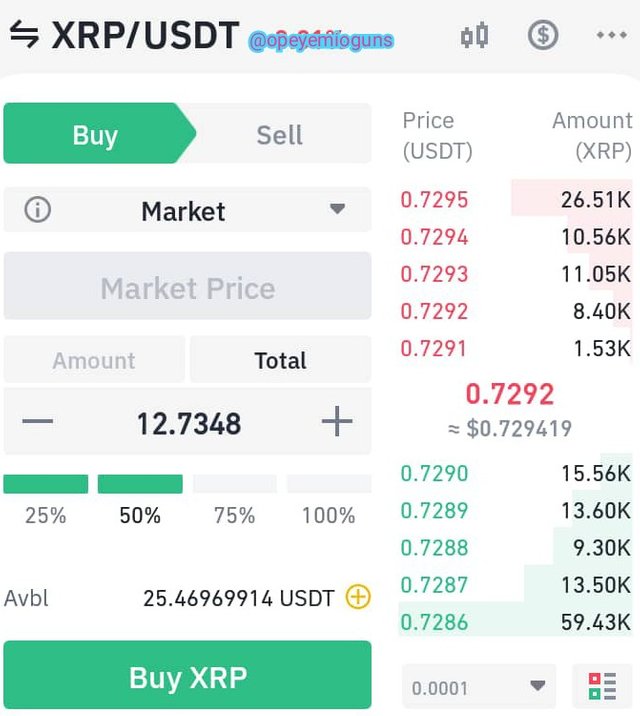
i made this screenshot on binance and edited it with imarkup
Conclusion
Before this course, I never even know that there's something called vortex indicator but now I do. With this Indicator, investors and traders can invest and trade easily But that's if they make use of it and follow it because some trading needs attention as you can't predict what can happen when the market would go bullish or bearish, Vortex indicator can only notify you when it's time to buy and time to sell with the indicator, not alarm.
This post was shared on twitter
https://twitter.com/opeyemioguns3/status/1424116215300202496?s=19
Hi @opeyemioguns, thanks for performing the above task in the sixth week of Steemit Crypto Academy Season 3. The time and effort put into this work is appreciated. Hence, you have scored 5 out of 10. Here are the details:
Remarks
We were hoping to see more depth and originality.