Trading with Accumulation / Distribution (A / D) Indicator - Crypto Academy / S4W5 - Homework Post for @allbert.
Hi Professor @allbert, I am @ononiwujoel one of your students in Crypto Academy and a member of the steemit platform and this is my homework submission post from your lecture Trading with Accumulation / Distribution (A/D) Indicator

1- Explain in your own words what the A/D Indicator is and how and why it relates to volume. (Screenshots needed).
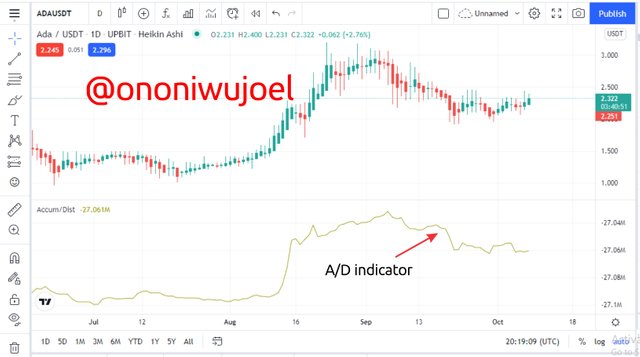
The Accumulation / Distribution indicator commonly abbreviated to A/D Indicator is a trading strategy used in technical analysis of charts. Like its name implies this indicator is focused on observing when an asset is on a general demand phase (accumulation) or a general supply phase (distribution). The former is when there are more buyers in the market and at such there is high demand for the asset which will of course make the price to surge higher while the later is the period of time when there are more sellers in the market hence making the demand to be low and supply high which then makes the asset price to fall.
A/D Indicator is not very popular among traders like the EMA and others, personally this is my own first encounter with the strategy but this doesn't make it less useful in any way, infact it is an added advantage if it is well understood and utilised since its not yet popular.
This indicator appears just like an oscillator with a scale to the right corner that is quite different from the scale in the chart. Now the A/D Indicator moves in the direction of price movement in the market based on the demand - supply phases of the market. So this can be used to discern when people are investing in the asset and when people are removing their investments in the asset, both cases directly affect the value of the asset in the market.
A/D Indicator can also be used to predict the future trends in a market, since it
Why A/D Indicator relates to Volume
Volume in a market refers to the amount of trade that is carried out in period of time so this can be said to be the level of liquidity of a market. The more people start trading a particular asset, its volume start increasing so whenever there is a strong bullish in an asset chart it indicates the is an increase in the market volume.
Having said this, since A/D Indicator observes market trends and phases of high demand or supply while the volume indicator also confirms the trading activities on the asset and by so doing confirms market trends then we can say they're very much related and will make an excellent pair if applied on chart together for technical analysis of the market.
2- Through some platforms, show the process of how to place the A/D Indicator (Screenshots needed).
I'll be using TradingView platform to show how to place the A/D Indicator with a step by step approach
- visit the tradingview platform site at tradingview.com

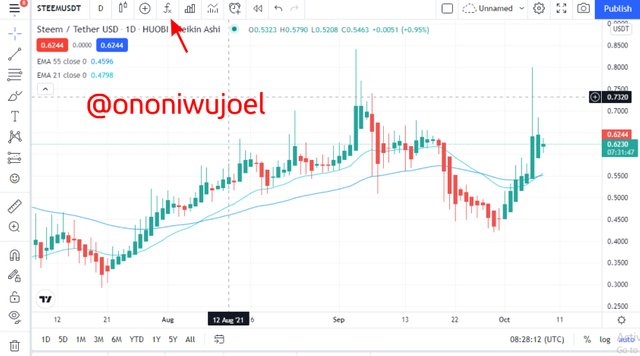
- Open an asset chart, I'll be using steem/usdt chart and click on the indicators & strategies button tagged fx at the top of the screen
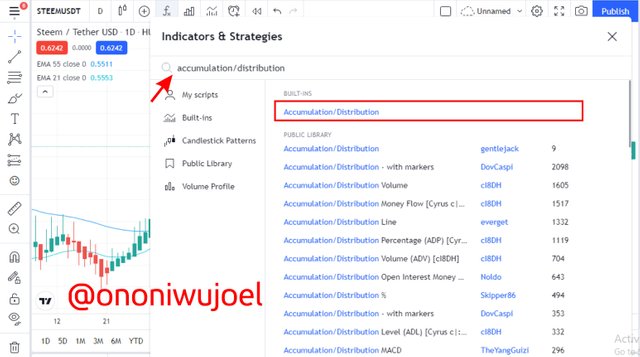
- Enter Accumulation/Distribution on the search bar and select it on the listed strategies to apply to chart.
Now we have applied the A/D Indicator to out steem/usdt chart.
3- Explain through an example the formula of the A/D Indicator. (Originality will be taken into account).
A/D Indicator Formula
The A/D Indicator Formula is largely based on volume and information from the candles and is very unique from other indicators formulas.
I'll start by listing out the parameters needed in the formula before explaining how they put together to calculate the A/D line.
Parameters
- Close => close of the current candle
- High => highest price of current candle
- Low => lowest price of current candle
- MFM => Money Flow Multiplier
- MFV => Money Flow Volume
- Period Volume => Volume of the current candle at the period
Formula Calculation
Firstly we start by calculating the Money Flow Multiplier (MFM) with formula;
MFM = (Close - Low) - (High - Close) / (High - Low)Next we calculate the Money Flow Volume with formula;
MFV = MFM x Period VolumeNow we use the information gotten so far to calculate the A/D line;
A/D = Pervious A/D + current MFV
Example of A/D Calculation
I'll be using a BTC/USD chart with a 1hr time frame on tradingview.com to demonstrate how to calculate A/D of an asset.
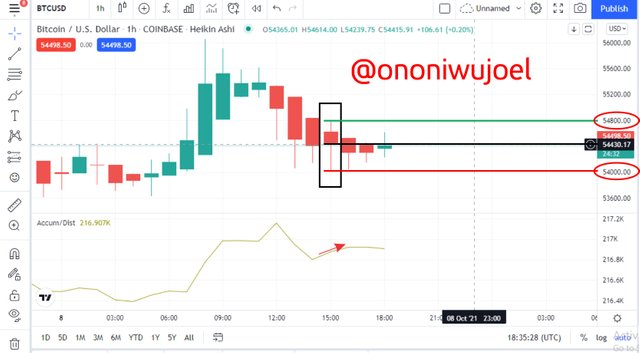
From the chart we can see the information on the highlighted candle which I will be focusing on as;
High = 54800.00
Low = 54000.00
Close = 54430.00
Previous A/D = 216,800
Period Volume = 285
- Now I'll calculate for Money Flow Multiplier
MFM = (54430.00 - 54000.00) - (54800.00 - 54430.00) / (54800.00 - 54000.00)
MFM = 0.075
- Calculate for Money Flow Volume
MFV = 0.075 x 285
MFV = 21.375
- Now we can calculate for Accumulation / Distribution line
A/D = 216800 + 21.375
A/D = 216821.375
4- How is it possible to detect and confirm a trend through the A/D indicator? (Screenshots needed)
A/D Indicator moves directly in the direction of price trend movement of the asset so its easy to detect trends through A/D Indicator.
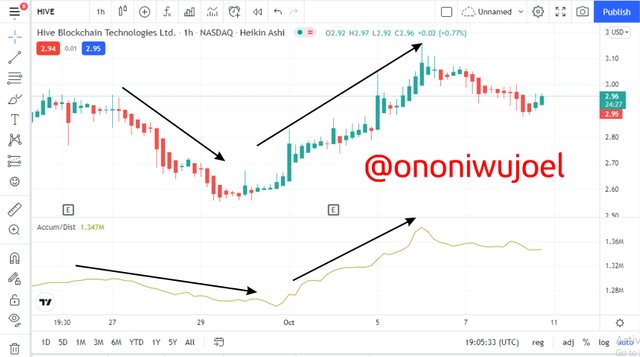
From the Hive/USDT chart above we can see how the A/D Indicator moves in direction of the price trend movements and confirms the trend.
Let's show cases of bullish, bearish and trend divergence respectively
Bullish trends
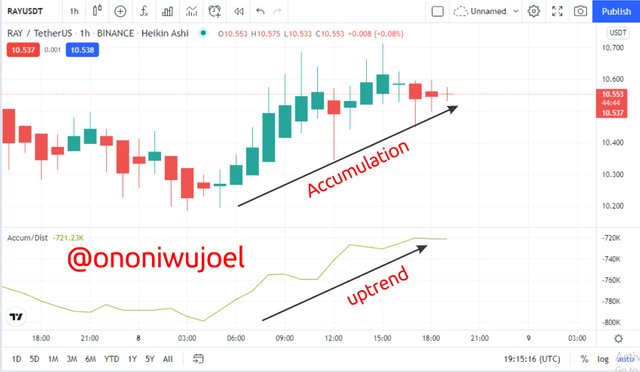
From the RAY/USDT chart above we can clearly see the market is on an uptrend and the A/D Indicator is also confirming the uptrend by moving in same direction with the uptrend. So in this way we can confirm that people are investing on the asset and the bullish is not a wrong call.
Bearish trends
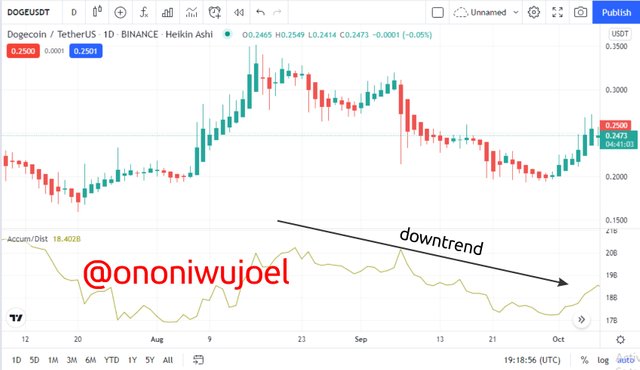
From the DOGE/USDT chart above we can see that the market is on a downtrend and the A/D Indicator is also moving in the direction of the downtrend thereby confirming that people are selling their assets and money is being distributed out of the asset.
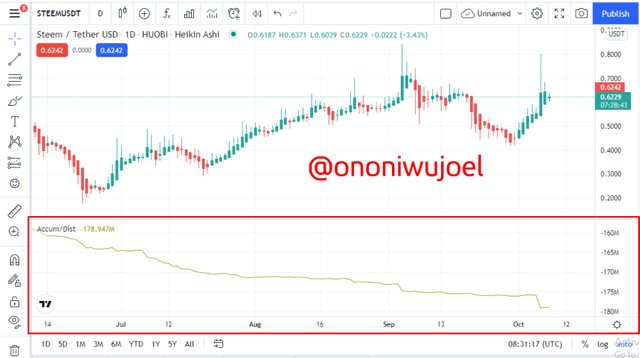
Trend Divergence
This is the major use of A/D Indicator that makes it unique and outstanding from several other indicators. This attribute makes it possible to detect a potential change of trend before it happens on the chart.
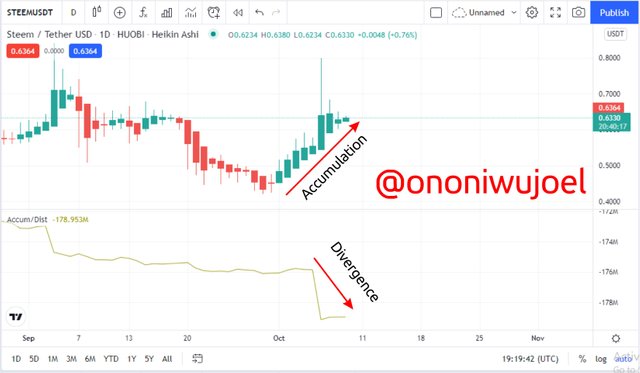
From the STEEM/USDT chart above we can observe that there is a bullish trend ongoing but the A/D Indicator is showing a downtrend instead, this means that people are now selling their assets and there will be a bearish trend very soon.
5- Through a DEMO account, perform one trading operation (BUY or SELL) using the A/D Indicator only. (Screenshots needed).
I'll be performing this task on tradingview.com with YGG/USDT chart with a 1day time frame.
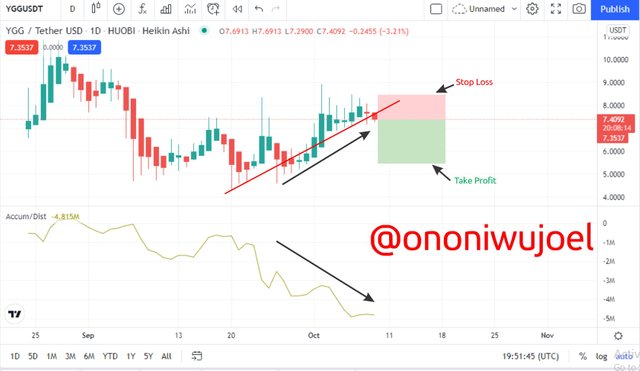
We can see that there's a strong Divergence on this asset price movement between the chart and the A/D Indicator. The asset is on a bullish trend but the A/D Indicator is showing a downtrend instead, so this means it is an opportunity to sell the asset now because money is leaving the asset and there will be a bearish trend soon.
After drawing a line to observe the trend, I place my order at 7.4120 with the Stop loss placed at 8.4120 and Take profit at 5.4120 making the profit/loss ratio 1:2.
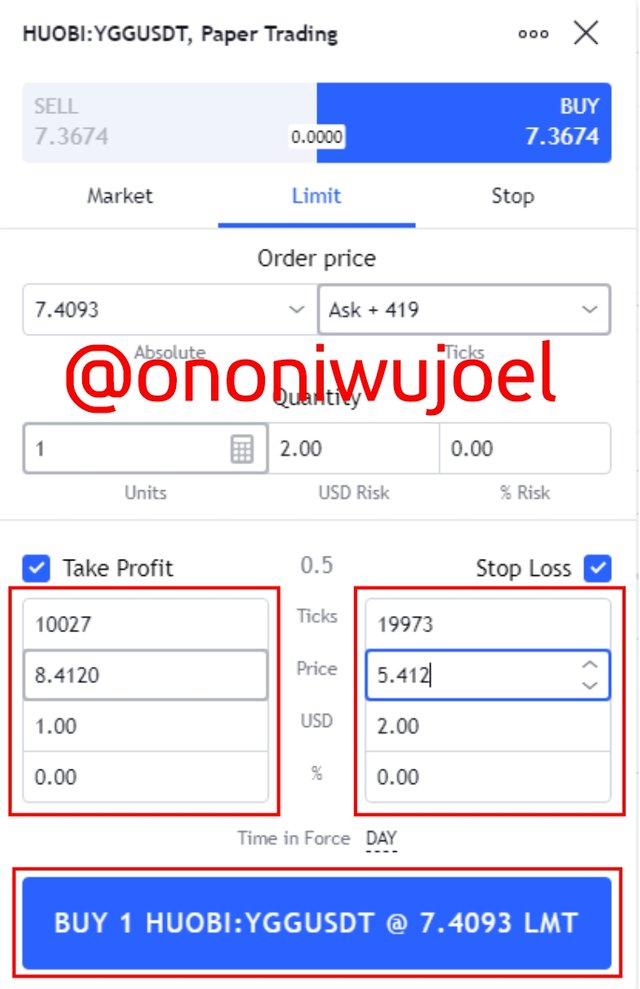
I used the Paper Trading platform on tradingview to execute the order.
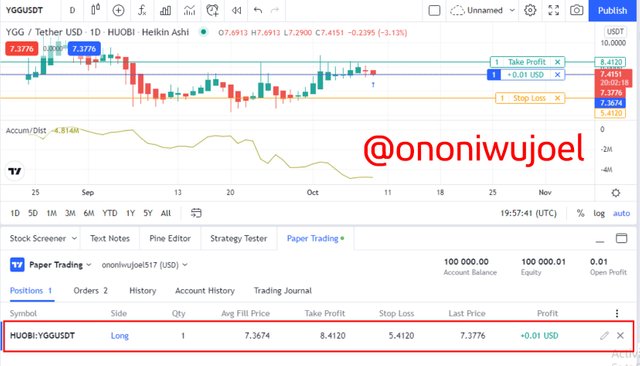
Trade is placed, but not succeeded yet
6- What other indicator can be used in conjunction with the A/D Indicator. Justify, explain and test. (Screenshots needed).
Random index (KDJ) indicator
I will be using the Random Index Indicator also known as KDJ indicator in conjunction with A/D Indicator for this task.
KDJ indicator is quite similar to the stochastic indicator but it is more accurate and easier to use in technical analysis and placing trade orders. It is called KDJ indicator because it's graph comprises of three lines which are the K-line, D-line and J-line.
KDJ is a very compatible with the A/D Indicator for collective use because while the A/D Indicator focuses on money flow and the volume at which an asset is being accumulated or distributed with very little information on the strength of trends, the KDJ indicator focuses on the strength of trends and is used to show when an asset is overbought or oversold. The KDJ indicator also shows Golden Cross which is a good opportunity to buy and Death Cross which is an opportunity to sell. The KDJ also has two horizontal lines which is usually at 80 and 20 on the scale by the right, when ever the price crosses 80 it means the asset is overbought and there will be a bearish soon so its a strong trend and when the price crosses point 20 it means the asset is oversold and there should be a bullish trend soon.
KDJ indicator is very useful and accurate indicator but is also not to be used alone so the idea of using KDJ indicator alongside A/D Indicator is a very good one and will help give better chances of making good profits from the trade.
Trade Example
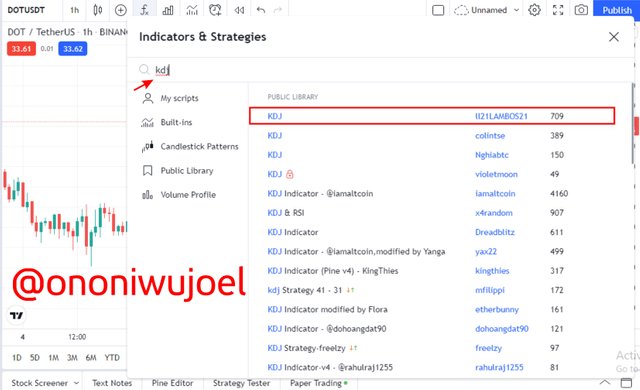
I start by adding the KDJ indicator to my chart on tradingview.com by clicking on Fx(strategy and indicators) option and then searching for KDJ.
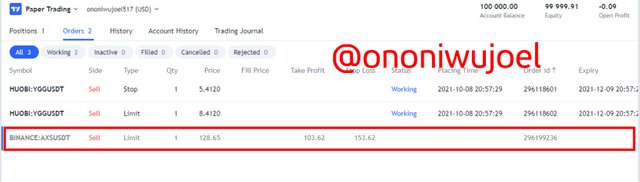
Now I'll be trading with AXS/USDT pair. Observing the AXS/USDT chart we can see that the asset is on a bullish trend but the A/D Indicator is showing a downtrend instead which is a bearish signal, and also the KDJ indicator has shown sign that the asset is overbought which is also a bearish signal so this is a good opportunity to sell and has been confirmed by both indicators. So I place my order
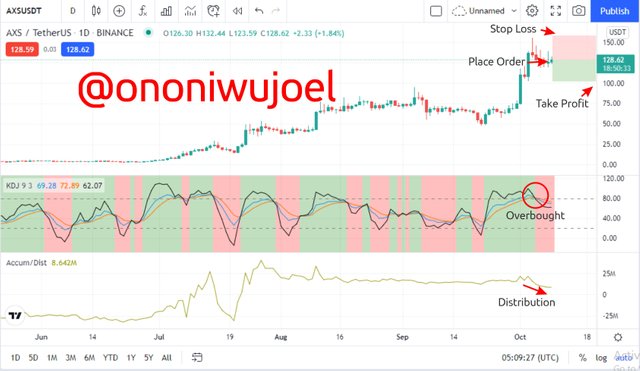
With my Trade Entry at 128.62, stop loss at 153.62 and Take profit at 103.62 hence making the profit/loss ratio 1:1.
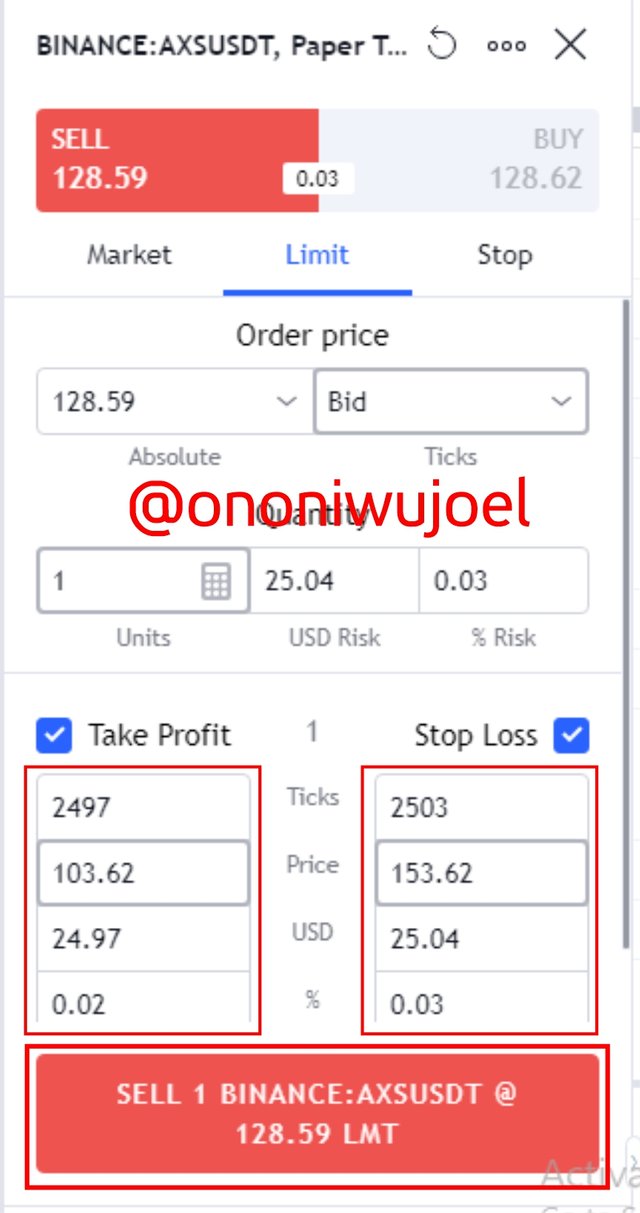
Order now places and awaiting execution
Conclusion
We all know that trading crypto is very risky and full of uncertainties even though it is also very profitable when you succeed in good trades and this is why we have so many useful strategies and indicators to help with technical analysis and making trade decisions.
This is actually my first time of coming across the A/D Indicator and so far I've found it easy and efficient to use especially the Divergence advantage it gives to help forecast a change in price trends.
I've also understood how the A/D Indicator is calculated and type of markets it can be very useful for. I must also say that it is much better to use the A/D Indicator alongside another indicator that can do the things A/D Indicator cannot do like KDJ, EMA or others.
It was a great lecture and I learnt a lot
Cc: Professor @allbert