Steemit Crypto Academy Season 4 Week 2 for Professor @reminiscence01- | Technical Indicators.by @olawole111
Good day steemians trust our day was good
Welcome to my seasons 4 week2 assignment on
Technical Indicators lectured by @reminiscence01 enjoy as you read through.
a) In your own words, explain Technical indicators and why it is a good technical analysis tool.
b) Are technical indicators good for cryptocurrency analysis? Explain your answer.
c) Illustrate how to add indicators on the chart and also how to configure them. (Screenshot needed).
Technical indicators are very useful and important in our day to day cryto Trading activities,
Technical Indicators are created using series of closing and opening prices of an asset over a period of time. Technical indicator helps to generate an accurate signal for making future analysis and decisions.
Technical indicator is the mathematical calculations of market movement and trends that allows trader to know the price movement ,the opening and closing time of the market cycle and they help in doing a smooth technical analysis in other to have a good entry and exit point
REASON WHY TECHNICAL INDICATORS IS GOOD
Trends :Technically indicators shows us the trend of the market, since our aim as a trader is to make profit we must not go against the trend because going against the trend might lead to loss of funds.
Bollinger bands is one of the indicators that shows trend whether uptrend or downtrend or ranging.entry and exit point: Technical indicators are so amazing , because they determine entry and exit point especially when using exponential moving averages when entry and exit point is known we will be able to maximize our profit and reduce losses.
market movement : Technical indicators help in determine the price movement in the market which is calculated mathematically using technical indicators, knowing the price movement will always show us the direction to go in the market.
b) Are technical indicators good for cryptocurrency analysis? Explain your answer.
Yes!!!
Technical indicator are good for every crypto trader, we have so many technical indicators though they are nor 100 percent accurate ,they need to be used with other technical analysis to make an entry technical indicators are so amazing because it helps to predict the price of
future crypto asset.
Using technical helps a trader to know the current trend of a market because as a trader we need to know how to identify the trend of a market and we must follow the trend there's a popular saying that the trend is your friend we must always follow the trend of the market because if we fail to to follow the trend of the market it might lead to lost of funds.
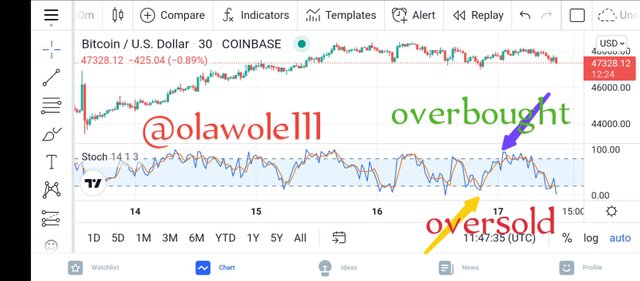
Technical indicators helps to know when revarsal is about to happen most especially when we use stochastic indicator, ADX e.t.c this indicator shows reversal signals, taking stochastic as a case study it has two lines in which one is faster than the other and when the fastest line enters the oversold or overbought region and thereby crosses the other line to the downward or upward its showing us a reversal signal.
We also have moving averages popularly known as ma's it is divided Intl two types simple and exponential moving averages moving averages indicate reversals and also indicate market trend on the market chart.
c) Illustrate how to add indicators on the chart and also how to configure them. (Screenshot needed).
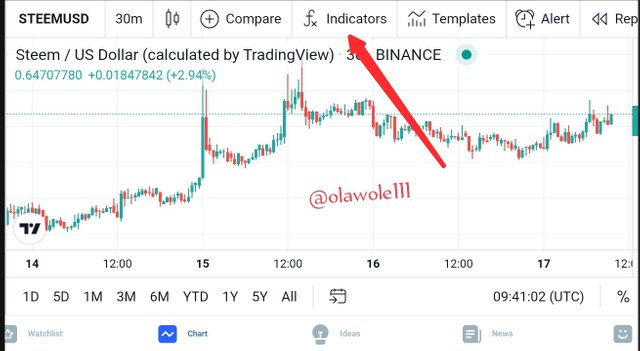
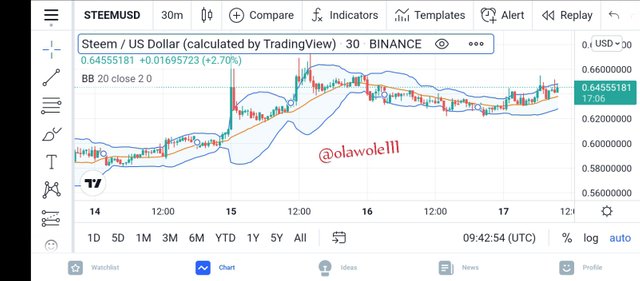
- Go to www.trading view.com and search for the crypto pair in the search box.

- haven picked the pair for instance in pick STEEMUSD
Then click on indicator at the upper side of the chart.
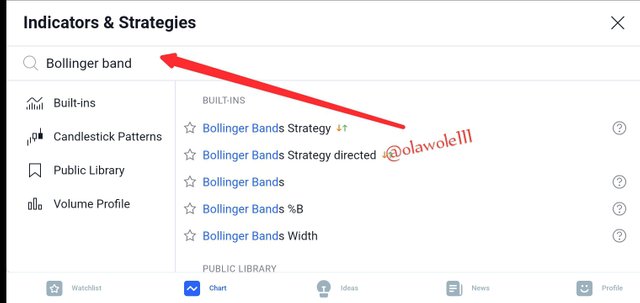
- Type the indicator you want to make use in the search box , here we are making use of Bollinger bands.
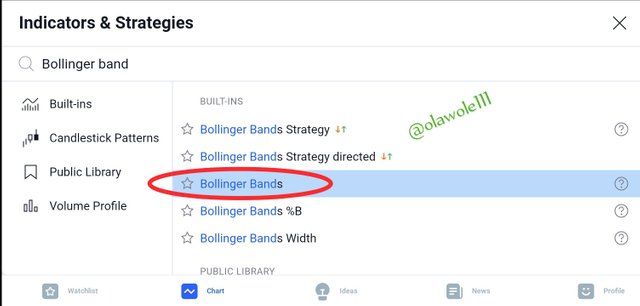
- After search it will bring the result then we click on the result.
- Then we go back to the chart to check if it has appeared on the chart.

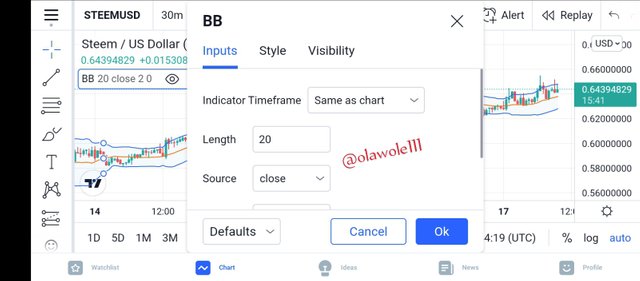
- After it has been added to the chart then we click on the indicator to configure or change some settings.
- It will bring another interface for settings here we can change the color, the MA's and other things.
we can also change the visibility setting to our taste
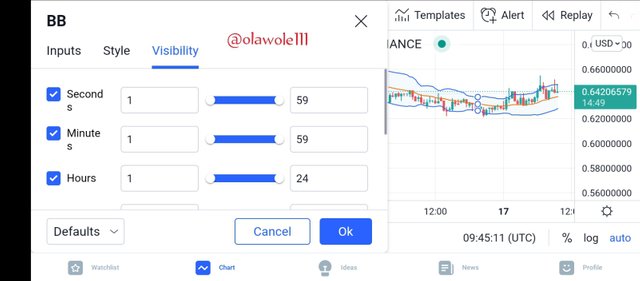
having done all this configuration we'll press OK to save the settings.
a) Explain the different categories of Technical indicators and give an example of each category. Also, show the indicators used as an example on your chart. (Screenshot needed).
b) Briefly explain the reason why indicators are not advisable to be used as a standalone tool for technical analysis.
c) Explain how an investor can increase the success rate of a technical indicator signal.
a) Explain the different categories of Technical indicators and give an example of each category. Also, show the indicators used as an example on your chart.
- Trend indicators
- Momentum indicators
- volume indicator
- mean reversion indicator
- Volume based indicator
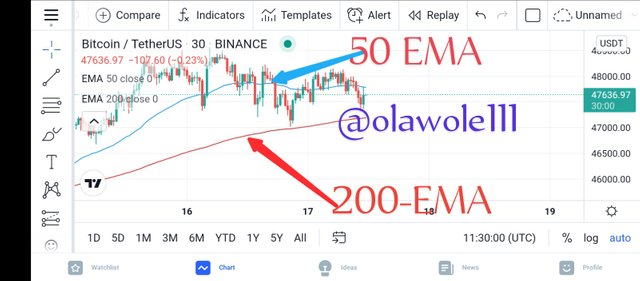
TREND INDICATORS
Trend indicators are indicators that shows the trend of market price either (upptrend, downtrend and ranging market) .
We have some indicators that shows trend which are ;
- 50-day EMA and the 200-EMA
- Average directional index(ADX)
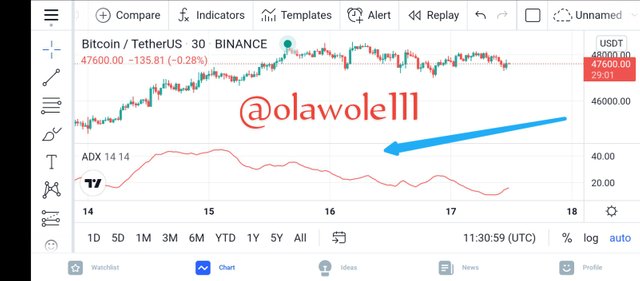
MOMENTUM INDICATOR
Momentum indicators are indicators that shows the the movement and the speed of market price over time.
We have some type of momentum indicators which are;
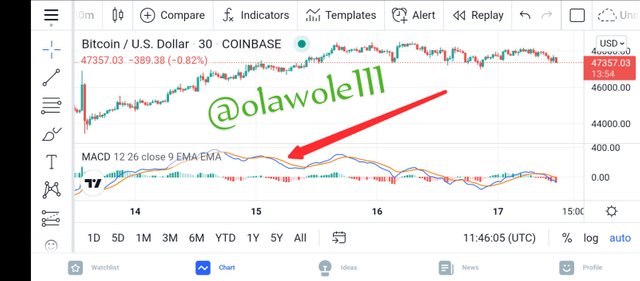
- MACD
- stochastic oscillator
VOLATILITY BASED INDICATOR
Volatility based indicator is used to determine the fluctuations of market price and is also used to know the swing high and swing low and we use it to check if volatility is high or low, we have some indicators that does the Job of determining volatility based indicator some examples are;
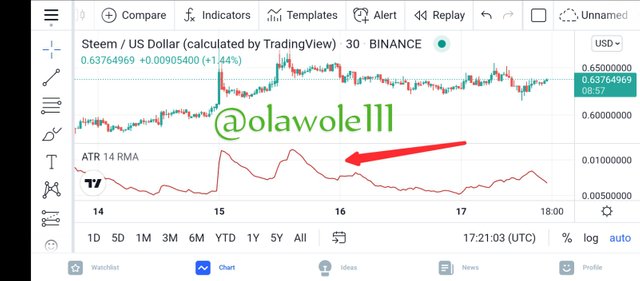
- Average true range
- Bollinger bands
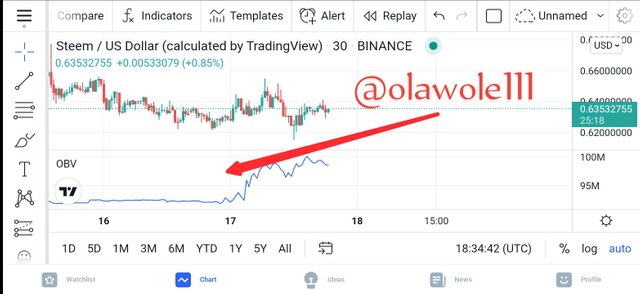
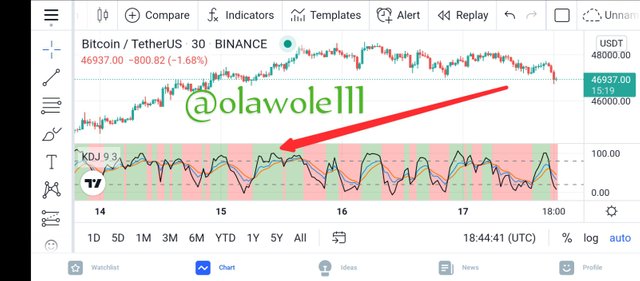
VOLUME BASED INDICATOR
Volume based indicator is used by crypto traders to know the the balance between demand and supply,it also help to know the market price strength and price direction.
Volume based indicator is used to know the trading volume in the market asset
- on balance volume indicator
- K D J
b) Briefly explain the reason why indicators are not advisable to be used as a standalone tool for technical analysis.
The use of technical analysis in of the common practice by traders of which traders uses technical to determine so many things in the market , they are used for know the trend , to get reversals , to get entry point and exit point.
Only technical indicator is not really advisable to use in isolation for example in our secular work of science when we add same component together it gives that same component , but when we have mixtures we are bound to get a new component and more stronger component.
This could be also applicable to the world is crypto, when we make uses of technical indicator and others things like candlestick pattern to analyze our chart technically, we will have a more strong and more reliable entry point , combining different technical tool will make our technical analysis strong and more precise in other to maximize the profit.
With technical analysis it is very easy to analyze the chart easily and make any reasonable decision on the market, **so it's Not advisable to use technical indicator for technical analysis.
c) Explain how an investor can increase the success rate of a technical indicator signal.
A crypto trader must know the basis of technical analysis, how to insert it in a chart how to do the configuration and how to use it to determine key levels in a market chart, success does not come in one day, an investor must take time to learn and be well grounded in the uses of technical indicator and an investor must not be found of using too many indicator in one chart.
The best thing to do is select like two or three technical indicators he / she wants to master , when an investor knows how to use those few indicator , it will reduse the level loss and maximize the level of profit.
CONCLUSION
Finally, Technical indicators are very important in trading , they are mostly used by traders to determine so many things in the trading cycle and technical indicator are not 100 percent accurate so it should not be used alone, it has to be combined with other technical analysis tool to have a more accurate entry and exit.
Thanks professor @reminiscence01 for the wonderful lecture.
Hello @olawole111, I’m glad you participated in the 2nd week Season 4 of the Beginner’s class at the Steemit Crypto Academy. Your grades in this task are as follows:
Recommendation / Feedback:
Thank you for completing your homework task.
Okay prof thanks sir