Steemit Crypto Academy Season 4 Beginner's Course - Task 10: Candlestick Patterns.
Good day steemians welcome to my beginners course task 10 trust our day was good, I will be writing on Candlestick Patterns lectured by @reminiscence01 .
2 a) In your own words, explain the candlestick patterns and their importance in carrying out effective technical analysis.
b) In your own words, explain the psychology behind the formation of the following candlestick patterns.
- Bullish engulfing Candlestick pattern
- Doji Candlestick pattern
- The Hammer candlestick pattern
- The morning and evening Star candlestick pattern.
- The Harami Candlestick pattern.
_1.png)
a) In your own words, explain the candlestick patterns and their importance in carrying out effective technical analysis.
CANDLESTICK PATTERN
Candle stick pattern is an important strategy to know as a crypto trader, they form depending on the market behavior, this pattern was discovers by a Japanese rice sell called Munehisa Homma,the knowledge of candlestick pattern gives trades an insight about what us going on in the market and we will be a able to predict what's going to happen in the future and helps us make a very good technical analysis for example, haven done all the technical analysis and the market is showing a reversal at the end of an uptrend.
A candlestick pattern like an inverted Hammer forming will indicate that the bulls are already loading their strength in the market while the bears is about to take over, mere seeing this candlestick pattern we are already getting a confirmation that is complementing our technical analysis that the market is about to reverse but most time we need to wait for a reteat b4 taking our entering point.
IMPORTANCE OF CANDLESTICK PATTERN
To Identify trends: candlestick pattern is an important tool we can't do without using as a crypto reader, it allow is to know the market trend, for example when we start seeing so many doji Candlesticks forming as a trader we already know that the market trend is either bullish or bearish but the market is ranging and when a market is ranging we are expected to Wait for a breakout whether continuation or reversal.
To compliment our technical analysis
Candlestick pattern compliment our technical analysis in such a way that it give traders insight about what's going to happen to the market in future, haven done all the technical analysis a candlestick pattern like inside bar will tell us that there's still a continuation in the market.
- Entry point and Exit point : candlestick pattern helps us as a trader to know rh the entry and exit point of a market commodity after doing all the necessary technical analysis, for example when a bearish engulfing is forming at the top of a downtrend its giving us a signal that the trend is about to end and a new trend is about to start,but as a trader we need to Wait for confirmation before we take our entry point in order not to trade fakeout , and supposing we are on a ongoing trade what we need to do is to get prepared to exit the trade as so as possible.
b) In your own words, explain the psychology behind the formation of the following candlestick patterns.
- Bullish engulfing Candlestick pattern
- Doji Candlestick pattern
- The Hammer candlestick pattern
- The morning and evening Star candlestick pattern.
- The Harami Candlestick pattern.
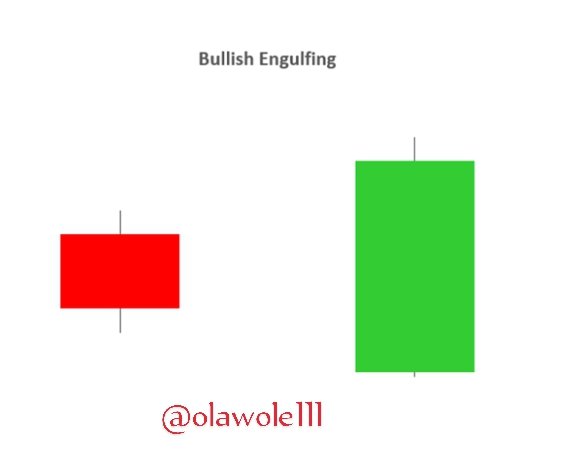
BULLISH ENGULFING PATTERN
Bullish engulfing pattern is a very important candlestick that indicate reversal, It forms when the bulls overshadow the bears completely.
When the a bullish engulfing Pattern is about to form, a small bearish candlestick come first and thereafter a big bullish candlestick with Small wick overshadows the previous bear candle, haven notice this in a chart we should know that a reversal is about to happen because the bull are becoming more strengthened and will soon take over.
DOJI CANDLESTICK PATTERN
Doji candlestick is a very strong candlestick pattern also which indicate (indecision) meaning the market is either going upward or downward and this candlestick pattern can occur anywhere in the market chart.
Doji is formed when a candlestick has a small body and a long wick on both upper side and the lower side of the candlestick.
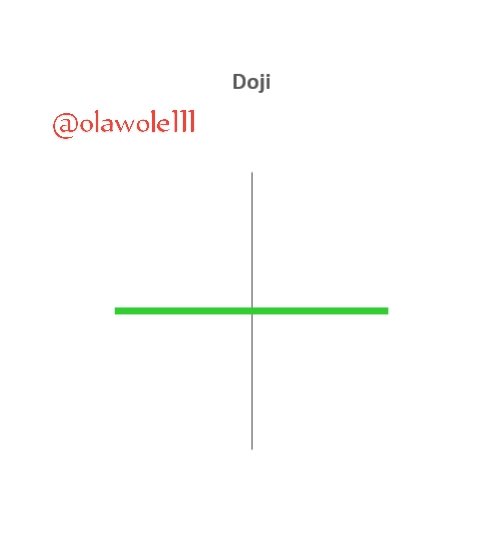
When we see a doji candlestick in a chart it indicate that the market is ranging and as a trader we are not expected to take any entry because the market price can breakout either ways , so we need to wait for that breakout before we take our so as not to fall into trap and **doji also means consolidation in the marketand it comes up when the bulls and bears are in a great Battle thats why the body is always small. We have three types of doji's which are dragonfly,long-legged and Gravestone
HAMMER CANDLESTICK PATTERN
Hammer candlestick pattern is a very strong reversal candle that appears at support and resistance levels. It's a very popular candlestick used by traders, the candlestick has a long wick showing rejection and a body above the wick , but the wick is always long than the body of the candlestick.
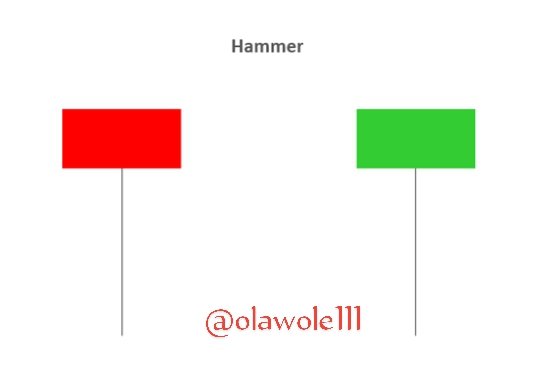
Before a hammer can be formed it means that the bulls are are really pushing the market upward and are ready to take control of the market that's why we have a long wick below the candlestick head.
MORNING STAR AND EVENING STAR
Morning star and evening star is a very important candlestick pattern in trading, it is a reversal pattern and it comprises of three candlesticks.
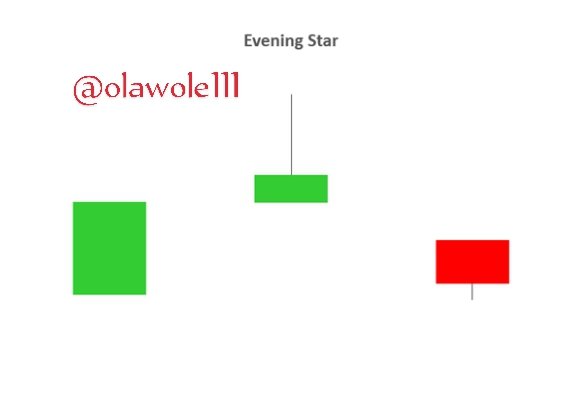
EVENING STAR
Evening star is a reversal candle that comprises of candles , the first two candles are bullish candle and the last candle is a bear candle, each time this candlestick pattern is found in a chart its already giving a reversal signal, so therefore we need to start looking for a way to quit the trade combined with other technical analysis.
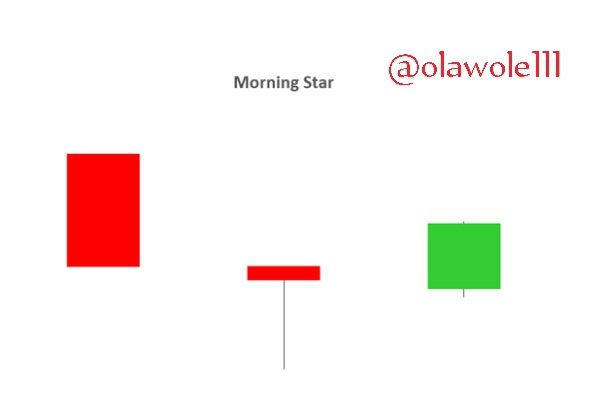
MORNING STAR
Morning Star is also a reversal candle,it also comprises three candlesticks in which that first two are bear candles and the last on is a bull candle, when this candlestick is formed it is showing us that a reversal is bound to happen SL we should be on the lookout.
HARAMI CANDLESTICK PATTERN
We have the bullish and bears Harami it looks like the engulfing candlestick but is the opposite of it because in this case that candle behind is the one covering the opposite candle, the harami candlestick shows us that there might be a reversal in a short while but it has to be combined with other technical analysis to confirm our decision.
_1.png)
CONCLUSION
Finally, candlestick pattern cannot be underemphasized in trading, it is very important because they show a lot of things on the market chart, we have lots of candlestick pattern we just decided mention few.
Thanks to professor for the wonderful lecture @reminiscence01