Crypto Academy Season 3 | Intermediate Course: Crypto Assets and the Random Index (KDJ)
Introduction
Hi guys, welcome the last week of the steemit crypto academy, am sire we all gained more knowledge, I will be writing my assignment on Crypto Assets and the Random Index (KDJ) lectured by professor @asaj ,enjoy!! as you read.

_1.png)
1. In your own words define the random index and explain how it is calculated
RANDOM INDEX (KDJ)
Random index indicator is created by Michael Poulos,It is used by traders and investors for technical analysis, random index indicator has some amazing functions that help traders in taking entry, this indicator helps in identifying price movement entry price and exit price and it also helps to know when price is about to U-turn and it also helps in identifying trend maybe its a strong trend or not.
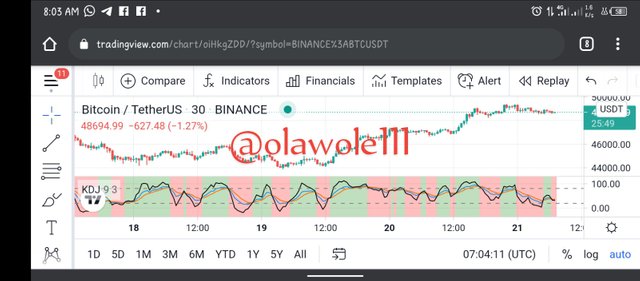
Random index is an indicator similar to stochastic indicator both had the k-line and D-line the only difference is the J-line, when we have a ranging market it's not advisable to use random index indicator because it might give fake out or false signals and it is not also advisable we use random index on a very low time frame because we might not get the original trend from the low time frame.
It also have overbought region and oversold region just like stochastic indicator their working principle are very similar to each other.
HOW DOES RANDOM INDEX WORK
Random index working principle is just like stochastic indicator as earlier said it has three lines which are the k- line D-line and j-line, when the j-line which is the fastest enters line the enters 20 region that means it is oversold meaning the the bulls are ready to take over and to confirm this, when the j-line crosses the other two lines upward then we should that we need to close our orders and leave the market.
Moreover, its it also applicable when the j- line Cross the 80 region above then cross the other two lines downward its giving a strong signal that a reversal is bound to happen, BUT before taking final decision we need to confirm other with other technical analysis.
HOW RANDOM INDEX IS CALCULATED
%K = (2 / 3 × Kp)+ (1 / 3 × RSV )
%D= (2 / 3 × Dp) + (1 / 3 × Kp)
%J = (3× %K) – (2 × %D)
This calculation looks a little bit complex and someone has to be calm before tackling it because we the k value of the day before we can get the D value of the day and we have to get both K and D value of the day before we can get the J value of the day.
Kp = value of the previous day for %k
Dp= value of the previous day for %D
%D = D value of the day
%k= k value of the day
%j = j value of the day
RSV is the immature index value of the %k %d and j%
RSV = (CN LN) / (HN LN) × 100
CN is equal to the closing price on nth day
HN is equal to the highest price on nth day
LN is the lowest price on nth day
When we can't find the value of kp and Dp it is advisable we use 50 to replace both of them
2. IS RANDOM INDEX RELIABLE?
To my own understanding in trading cryptocurrency I can't really say random index(KDJ) is 100 percent reliable because indicators fails at times, as a trader before we can take an entry using indicators we need to merge it with other technical analysis to know of both are in same page or they are contradicting each other, having done the comparing and contrasting and both are walking towards same direction then we can now take our trade.
One thing a trader should note is that it not really advisable for someone to be using too much indicators we can just take two or three indicator maximum and master them well on our demo account, having know them well and how we can combine them then we can now have like 80% assurance that we the right placement in the market.
Therefore, I can't really say random index is 100 percent reliable to take a trade.
3. HOW IS THE RANDOM INDEX ADDED TO A CHART AND WHAT ARE THE RECOMMENDED PARAMETERS
- STEP ONE : Go to your trading view or www.tradingview.com
- STEP TWO: select the cryptocurrency pair you want to make use of and it will appear on the chart.
- STEP THREE: click on indicator above the the chart, it will take us to a search box
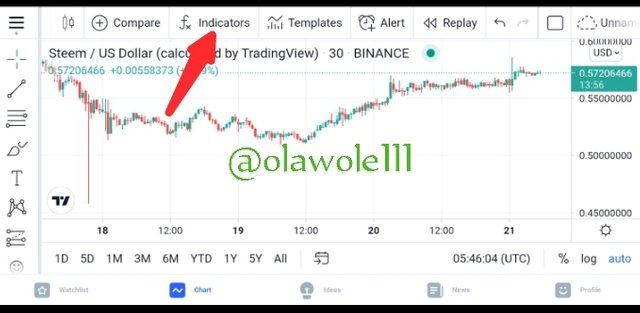
- STEP FOUR : input (KDJ) inside the chart box, then it will bring list of indicators related to what has been searched.
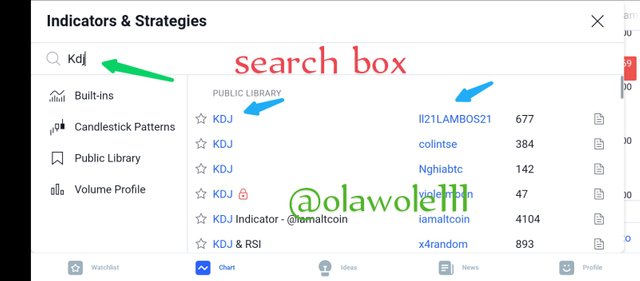
- STEP FIVE: click on the first one that has the code ll21LAMBOS21, after clicking then we go back to the chart we will find it there on the chart.
THE RECOMMENDED PARAMETERS OF RANDOM INDEX INDICATOR
we have five very important parameters on the random index indicator.
K- line
D- line
J-line
OVERSOLD REGION
OVERBOUGHT REGION
k-LINE
The k-line is the blue line in between red and black line.
D-LINE
The D-line is represented with the red line on the random index indicator.
J-LINE
The j-line is a very important line which is the black line, it shows the movement of the trend and is the fastest among the three lines, if it crosses the other two lines upward or downward its showing a reversal signal.
OVERSOLD REGION
Just like stochastic indicator same here in random index, it has a range of 0-100 and the oversold region falls within the range of 20-0 and when the black line gets there, then we should be prepared for a U-turn in trend.
OVERBOUGHT REGION
As it was explained above that random index has range of 0-100, when the range falls within 80-100 it means it is overbought and the bears are about to take over the market.
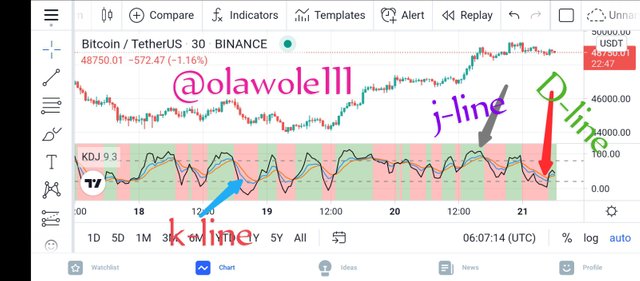
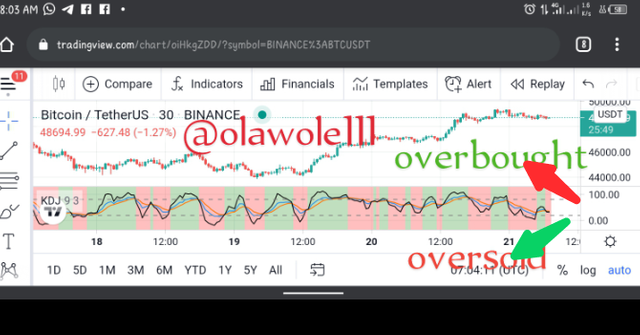
The two screenshots above is indicating all the five important parameter mentioned earlier.
4. DIFFERENCE BETWEEN KDJ,ADX AND ATR.
| KDJ | ADX | ATR |
|---|---|---|
| kDJ means k-line,d-line and j-line | ADX means average directional movement index | ATR means average true range |
| KDJ can't be used on short time frame | ADX cannot show a statistical movement of the asset price | ATR shows the statistical movement of the asset price. |
| KDj cannot be used in determining stop loss | ADX shows us trend of the market | ATR is shows volatility of the market . |
5. Use the signals of the random index to buy and sell any two cryptocurrencies.
I used tradingview for my trade, I choose BTCUSD using the KDJ indicator.
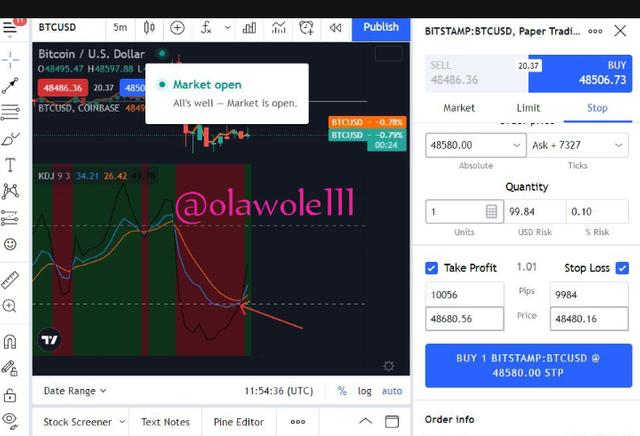

I took this buy trade when i noticed the golden fork I.e when then j-line crosses the other two lines below the 20 range(oversold) and I made profit of $93.97.
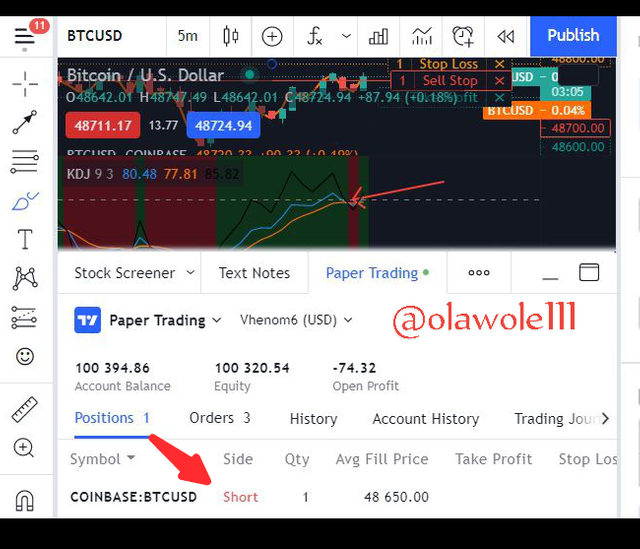
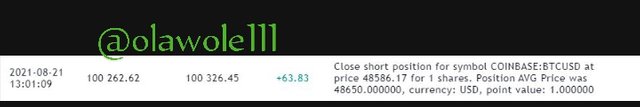
I took this sell trade on BTCUSD when I noticed the dead fork I.e the lines are crossing each other on the (overbought region) combined with other technical analysis.
I decided to take this trade and I made profit of
$63.83 from the entry I took.
CONCLUSION
Finally, random index indicator helps in identifying price movement entry price and exit price and it also helps to know when price is about to reverse and traders should always combine other technical analysis with KDJ in other to have a better entry.
Thanks to professor @asaj for this interesting lecture wish to learn more from you next season.
Superb performance @olawole111!
Thanks for performing the above task in the eighth week of Steemit Crypto Academy Season 3. The time and effort put into this work is appreciated. Hence, you have scored 8 out of 10. Here are the details:
Remarks
Overall, you have displayed a good understanding of the topic. You have performed the assigned task excellently. However, you did not provide the configuration settings of KDJ indicator in task 3. Also, task 4 could use more research.
That said, this is good work. Thanks again for your contributing your time and effort to the academy.
Okay sir ,thank you professor