Trading Crypto with On-Balance Volume Indicator - Crypto Academy / S5W4 - Homework Post for @fredquantum
Hello..!!
My Dear Friends
This is @ns-porosh from Bangladesh 🇧🇩
Introduction
How are you all? I hope you are well by the grace of God.I am well with your prayers and mercy God's grace.At first of all thank you to the sir @fredquantum. Your lesson provides a lot of information on homework tasks.Anyway let's get started now......
1:-In your own words, explain your understanding of On-Balance Volume (OBV) Indicator.
In 1963, a man named Joseph Granville created the OBV Index. OBV is an indicator used in trading that predicts the movement of equity price based on volume flow through technical analysis. The OBV index predicts the value of an asset with reference based on the amount of asset purchases and sales in the market. This means that if an asset is bought or sold in the market, OBV depends on the added volume through this index technical analysis. The value of the asset determines the direction. If the amount of asset purchase in the market is high then this index will show a group of highs and lows in the chart which will indicate that the value of the asset will go up. Again when the measure of asset sales in the market is high then this index will show a group of highs and lows in the chart which will indicate that the value of assets is going down.
Screenshot Source
Traders can predict the market price with the help of obv index. Even when traders start trading in the market for the purpose of trading in the market, they start trading by observing the difference between the price and the index before the asset so that the traders do not face any loss in business. If the current trading volume is greater than the trading volume of the previous day, then adding the volume of both days results in the current or today's OBV. Again if the current trading volume is less than the trading volume of the previous day then the result of subtracting the current volume from the previous day's volume is the current or today's OBV. Using obv to trade new traders will enable them to determine what kind of market they will see in the future and make it easier for them to trade.

2.-Using any charting platform of choice, add On-Balance Volume on the crypto chart.
I will use the TradingView platform to answer this question. The TradingView platform has almost all indicators and is very easy to use. Below is a screenshot describing how we can add an on-balance volume to a trading chart:
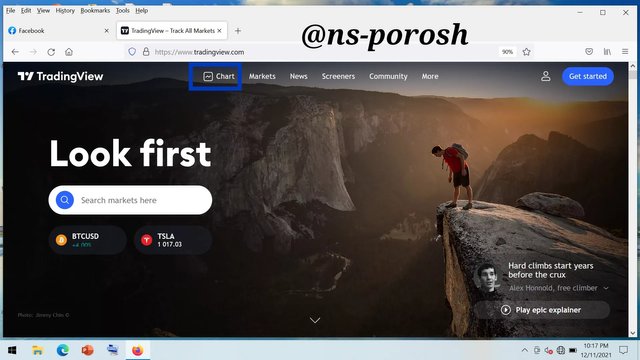
Step:-1 First of all we have to enter this link Link and go to the trading view platform.
Screenshot Source
Step:-2 Then click on the chart icon.
Screenshot Source
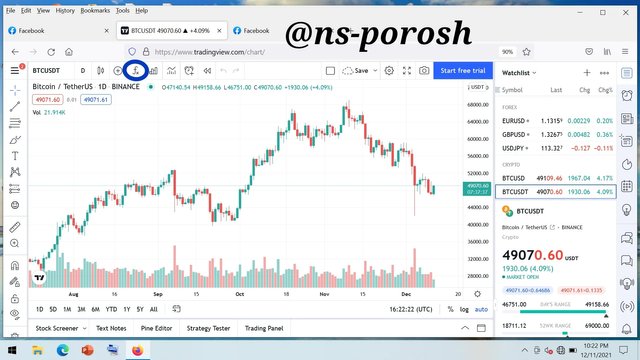
Step:-3 Next click on the chart icon then click on the fx icon at the top of the chart.
Screenshot Source
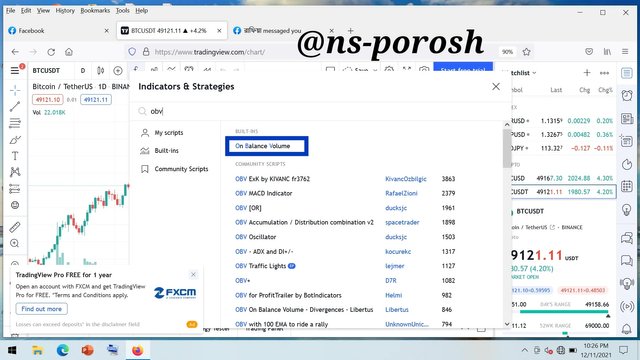
Step:-4 In this step you need to search the On Balance Volume to add the On Balance Volume Index to the chart.
Screenshot Source
Step:-5 Next click on On Balance Volume and add to the chart.
We can add indicators to the chart by using the above method.
3:-What are the Formulas and Rules for calculating On-Balance Indicator? Give an illustrative example.
Like other indicators, the OBV index has some mathematical formulas. The current on-balance volume can be calculated using these specific formulas. This means that the value of the OBV index is obtained by adding or subtracting the current volume of the asset, depending on the previous day's value of the asset using this formula. There are three possible formulas for calculating OBV. The details are discussed below:
- 1):-The formula will be if the current time end or end price is higher than the previous time closing price, OBV = previous OBV + current volume
- 2):-The formula will be OBV = Previous Period OBV - Current Period Volume if the end of the current period or the closing price is less than the closing price of the previous period.
- 3):-If the end of the present period or the closing price is equal to the closing price of the previous period, the formula will be, OBV = OBV of the previous period.
Example
Let us now look at the use of these formulas through a 5 day example.
Suppose, for the first day, closing price = $ 10 and volume = 30,000
In case of second day closing price = $ 20 and volume = 45,000
In case of third day closing price = $ 15 and volume = 40,000
In case of 4th day closing price = $ 20 and volume = 40,000
In case of fifth day closing price = $ 20 and volume = 20,000
The OBV values are given below as per the example of 5 days above:
Here,
First day OBV = 0
Second day OBV = 0 + 45,000 = 45,000
Third day OBV = 45,000 - 40,000 = 5,000
Four Day OBV = 5,000 + 40,000 = 45,000
Fifth day OBV = 45,000
Above I added the closing price of the second and third day because the closing price of the second and third day was higher than the closing price of the previous day. Again on the third day we are subtracting because the closing price of the third day is lower than the closing price of the previous day. Also the closing price of the fourth day and the fifth day is equal.
4:-What is Trend Confirmation using On-Balance Volume Indicator? Show it on the crypto charts in both bullish and bearish directions
Every trader wants to be profitable in business so it is very important for a trader to understand the market trends. Every trading trader understands the market forecast by looking at different indicators before trading. The OBV indicator plays an important role in predicting market movements. If there is more pressure to buy assets in the market then the price of assets will increase then OBV indicator will give a signal and this is the uptrend. This is the perfect time to buy. Again, when the selling pressure of assets in the market is high then the price of assets decreases then the OBV indicator will give a signal and this is the downtrend. This is the perfect time to sell. Below is a detailed discussion of uptrend (bullish market) or downtrend (bearish market) with screenshot.
Uptrend (bullish market)
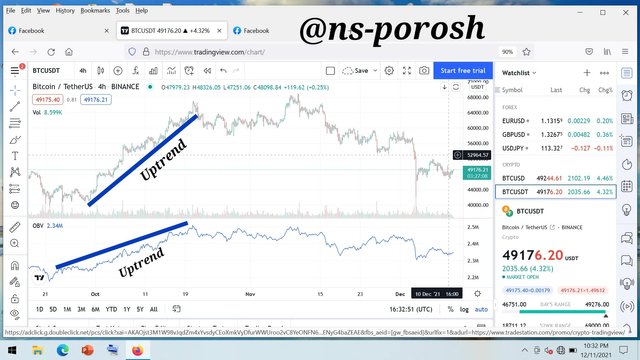
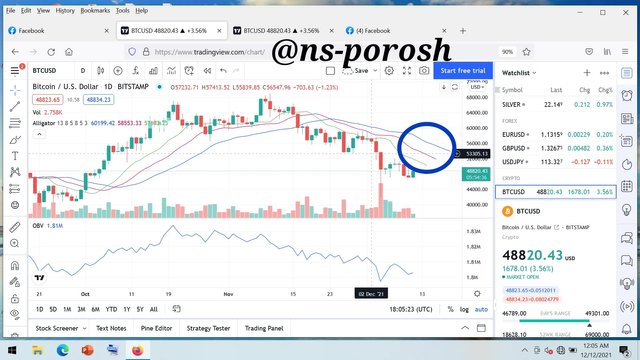
The line of the OBV index is influenced by the amount of asset buying and selling pressure in the market. When the high buying pressure of assets in the market continues to increase the price, the on-balance volume breaks the previous highs and creates highs and lows. This is called uptrend / bullish trend. By bullish trend it is understood that the market is likely to continue to move further upwards.
Screenshot Source
Notice in the screenshot above that the line height of the OBV indicator is breaking and getting higher. This means that the market is now in an uptrend.
Downtrend (Bearish Market)
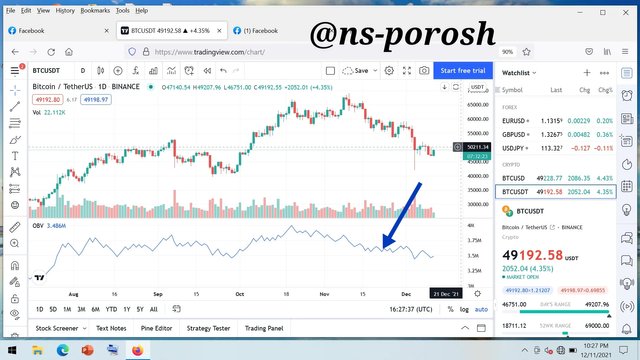
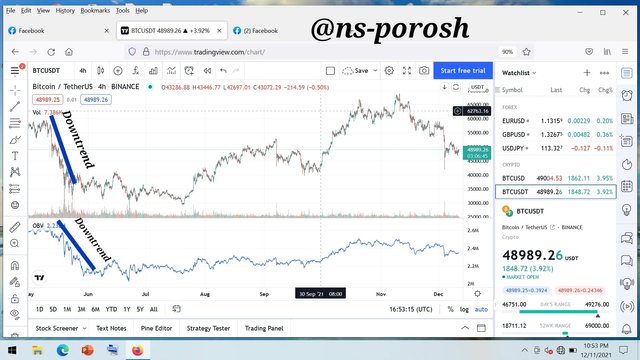
In the same way, when the price of assets in the market goes down, the line of on-balance volume is getting lower and the high is getting lower. This is the downtrend (bearish market). Downtrend means that the value of assets in the market has started to go down.
Screenshot Source
Notice in the screenshot above that the line higher in the OBV index is also getting lower. This means that the market is now in a downtrend.
5:-What's your understanding of Breakout Confirmation with On-Balance Volume Indicator? Show it on crypto charts, both bullish and bearish breakouts.
A break-out occurs when the market suddenly moves in an uptrend or downtrend after a sudden accumulation of prices for some time. That means breakouts in the market can go up or down. The on-balance volume indicator enables traders to determine price breakouts when the market is pumping and declining. Bullish and bearish breakouts are discussed below to confirm the breakout with the on-balance volume indicator.
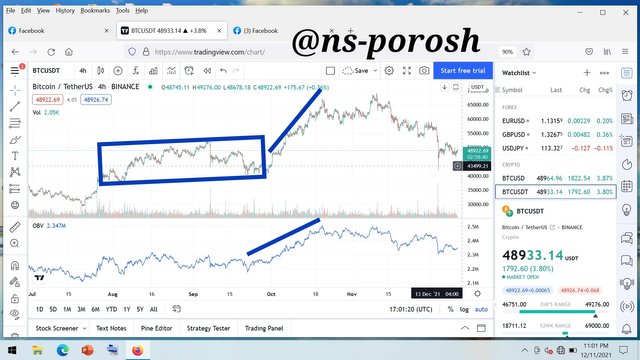
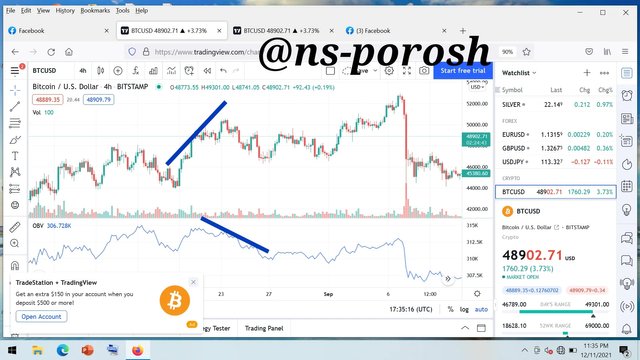
Bullish Breakout
Screenshot Source
A bullish breakout in the market occurs when the price consolidates for a while but does not cross the resistance level but after some time the price breaks the resistance point and the OBV indicator moves upwards without crossing the resistance level. This is how we ensure a breakout in the market. This time is basically the right time for traders to buy assets.
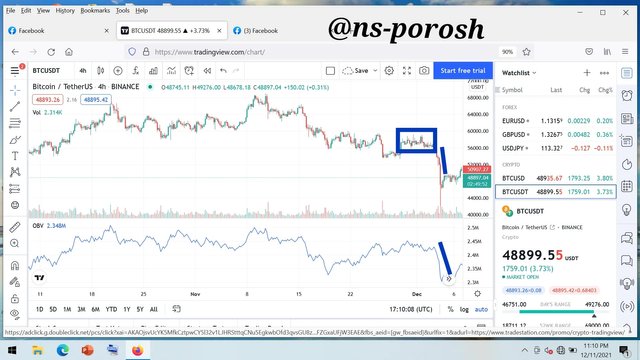
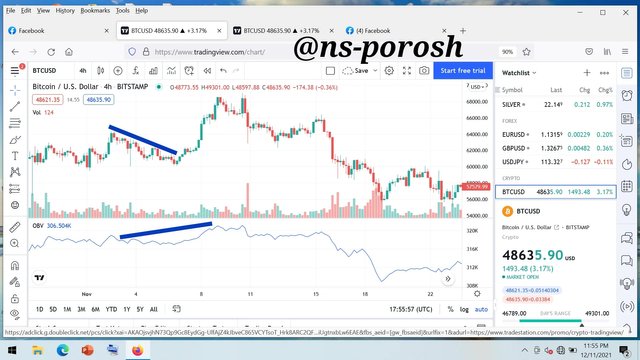
Brearish Breakout
Screenshot Source
The bearish trend basically occurs when the price gathers for a certain period of time and goes to a certain resistance level and breaks the resistance / support level after a certain period of time and the OBV indicator goes down without going above the resistance level. This is how we ensure a bearish breakout. This is a good time to sell your assets.
6:-Explain Advanced Breakout with On-Balance Volume Indicator. Show it on crypto charts for both bullish and bearish.
We already know how to ensure a breakout using the OBV indicator. Now we will learn how to ensure advanced breakout using OBV indicator. Heavy buying or selling pressures by traders can lead to advanced breakouts. Advanced breakout occurs when an asset fails to break the previous high price or low price but the OBV index breaks the previous high price and low price. The details are discussed below:
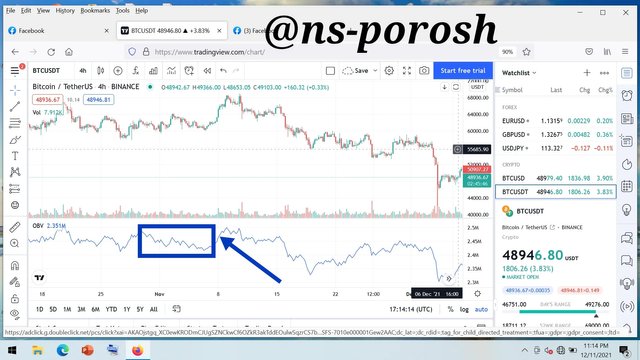
Bullish Advanced Breakout
Screenshot Source
Bullish Advanced Breakout occurs when the asset price is not able to break above the previous high but OBV breaks above the previous high. This time Bullish Advanced Breakout signals that the market volume is high and OBV is strong but asset prices are much lower. At this time it signals traders to buy assets.
Bearish Advanced Breakout
Screenshot Source
Bearish Advanced Breakout also occurs when OBV breaks the previous low value of the asset but is unable to break the previous low value of the asset. Bearish Advanced Breakout This time signals that the market volume is declining and the market is going down a lot as it comes.
7:-Explain Bullish Divergence and Bearish Divergence with On-Balance Volume Indicator. Show both on charts.
Both bullish divergence and bearish divergence are very important for traders. If a trader fails in both cases, they will not be able to make a profit. Traders take steps to enter or exit the market through bullish divergence and bearish divergence analysis. Below is a discussion of bullish divergence and bearish divergence with screenshots:
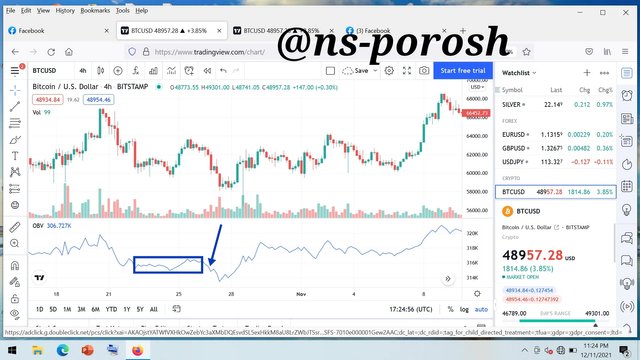
Bullish divergence
Screenshot Source
Bullish divergence mainly occurs in cases of downward trend. The price of an asset continues to decline during bullish divergence but the OBV index line continues to rise. When such a situation arises in the market, it indicates that the market trend is weakening. Bullish divergence indicates that asset prices may rise in the future. So now traders should buy assets.
Bearish Divergence
Screenshot Source
Bearish divergence mainly occurs in cases of upward trend. During this time the price of an asset continues to rise and the line of the OBV index continues to fall. At this time the trend will reverse and indicate the beginning of the rise. Bearish divergence indicates that the price of the asset may decrease in the future. So now traders should sell their assets.
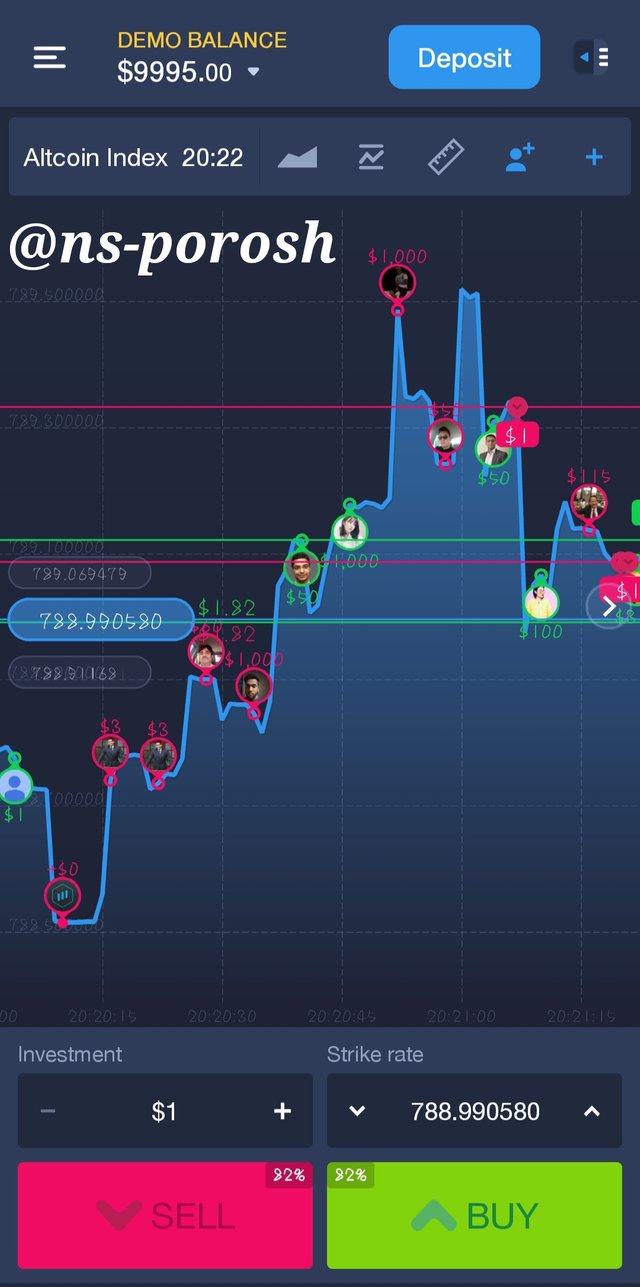
8:-Confirm a clear trend using the OBV indicator and combine another indicator of choice with it. Use the market structure to place at least two trades (one buy and one sell) through a demo account with proper trade management.
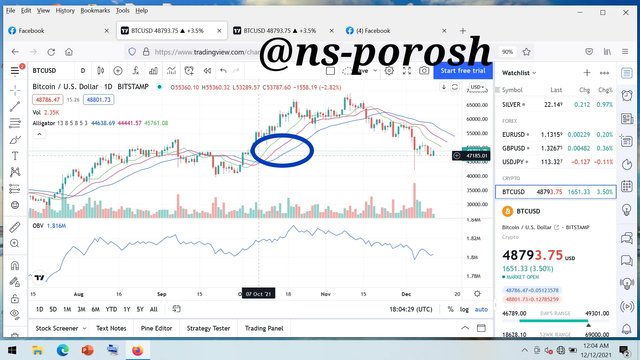
Buy Trade:
I added another indicator to my trading view chart to make a profit by purchasing business assets called Alligator Indicator. With Alligator Indicator I can easily get buy signal from my trading view chart. The alligator indicator has three lines. If the green line at the base of the three lines is above all and the red line in the middle and also the blue line at the end then I get a signal of buy signal through the indicator. Notice the screenshot below.
Screenshot Source
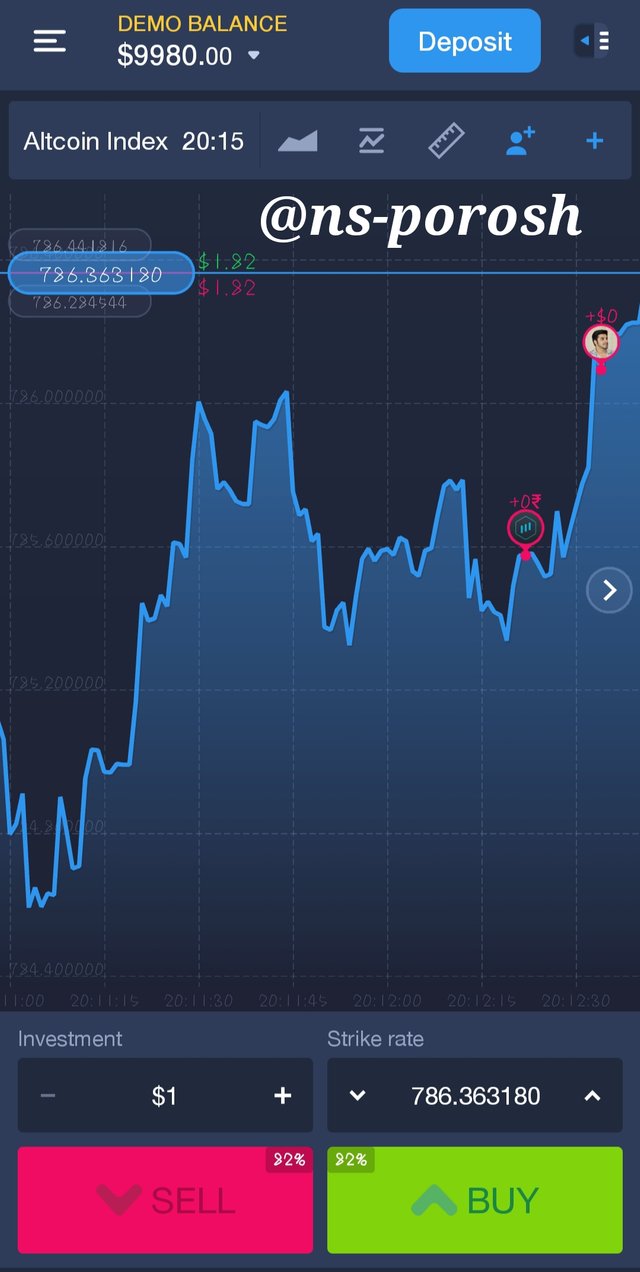
Sell Trade:
Again I aim well at the alligator indicator added to my trading view chart to make a profit by selling business assets. When the blue line in the alligator indicator is above the red and green line, the indicator signals me to sell the asset. This is the cell signal. Notice the screenshot below.
Screenshot Source
9:-What are the advantages and disadvantages of On-Balance Volume Indicator?
Advantages
- The on-balance volume indicator is very easy to use. Using this indicator, traders will be able to easily understand the predictions of the trading platform.
- The OBV indicator provides timely signals such as confirmation of market trends, variability, price breakout.
- One has the ability to operate in any type of market and the indicator is suitable for any type of trade.
- Traders do not need much technical knowledge to use the indicator.
Disadvantages
The biggest drawback of the OBV index is that investors cannot make accurate decisions in a short period of time using this indicator.
The OBV indicator can sometimes give false signals which can lead to market volatility.
- Just as each indicator has some faults, so does the OBV index. This indicator is not 100% accurate. So in addition to this index other indicators should be added for trading.
- The OBV indicator does not indicate the price movement of the market which is why we cannot trade.
Conclusion
I have gained a lot of knowledge about OBV from this lecture of Sir. OBV trade is very important for traders. Traders can use the OBV indicator to predict the train market. The OBV indicator provides an indication of when traders will enter and exit the market. In order for this indicator to work properly, it needs to be accompanied by other indicators, and it is able to filter out the false signals generated by other indicators. By using this indicator, traders will be able to avoid losses and gain.Thank you very much sir @fredquantum for this beautiful lesson.

You have been upvoted by @sm-shagor, a Country Representative of Bangladesh. We are voting with the Steemit Community Curator @steemcurator07 account to support the quality contents on steemit.
Follow @steemitblog for all the latest update and
Keep creating qualityful contents on Steemit!
Joining #club5050 for Extra vote.😊