Crypto Trading With Alligator Indicator - Crypto Academy /S5W3-Homework Post for kouba01
Hello..!!
My Dear Friends
This is @ns-porosh from Bangladesh 🇧🇩

Introduction
How are you all? I hope you are well by the grace of God.I am well with your prayers and mercy God's grace.At first of all thank you to the sir @kouba01. Your lesson provides a lot of information on homework tasks.Anyway let's get started now......
1.-Discuss your understanding of the use of the Alligator indicator and show how it is calculated?
In 1995, Mr. Bill Williams discovered the Alligator Index. Mr. Bill Williams is the founder of the Alligator Index. In the crypto market, crypto traders always analyze the crypto market in order to get more profit from their business. And traders use multiple indicators in the crypto market to do this analysis. We generally know that investing in the crypto world without proper analysis is foolish and very risky. Traders can analyze the market by looking at the indicators and be aware of the future of the market. In other words, traders use this indicator to get forecasts of the next market. Movement, market price, market trends, etc.
The alligator indicator has three different colored lines. These lines are mainly used to indicate the structure of the trend and the direction of the trend. The lines are named after different parts of the alligator animal. The three different colored lines are known as the jaws, teeth and lips of the alligator animal. The blue line represents the jaws of the alligator animal. The red line represents the teeth of the alligator animal and the green line represents the lips of the alligator animal. Like other indicators in the crypto market, Alligator Indicators also help crypto traders to make their business successful and make good profits in the business.
The alligator lines are briefly discussed below.
Jaw: The jaw line indicator is the blue line. The time frame of the line is 14 periods and the offset of this part is 8. The slowest moving average of the alligator indicator is the jaw or blue line.
Teeth: The tooth line indicator is the red line. The time frame of the line is 8 periods and the offset of this part is 5. This line represents the middle of the three moving averages of the alligator.
- Lips: The lip line is the green line of the indicator. The time frame of the line is 5 periods and the offset of this part is 3. The slowest moving average of the alligator indicator is the jaw or blue line.
Alligator Instructor Alligators work on animal principles. The alligator animal becomes more hungry when it sleeps for a long time and finally when it wakes up. These works of animals point in different directions in the market. For example, the more the alligator sleeps, the more hungry it becomes. It actually decides to move the market towards a stable trend. Traders do not take any business action while the alligator is sleeping.
When he wakes up he starts looking for food to satisfy his hunger and he becomes very aggressive. In a word, he became a monster for food. At this point he eats whatever he sees in front of him. This means that traders can secure their business at this time because this time is similar to crypto trade.
How To Calculate The Alligator Indicator
MEDIAN PRICE = (High + Low)/2
ALLIGATORS LIPS =SMMA / Smooth Moving Average (Median Price 5, 3)
ALLIGATORS JAW = SMMA / Smooth Moving Average (Median Price 13, 8)
ALLIGATORS TEETH = SMMA / Smooth Moving Average (Median Price 8, 5)
MEDIAN PRICE = (High + Low)/2
Here,
High = Highest price and Low = Lowest price
SMMA = Smooth Moving Average
The blue line in the calculation of the alligator index is the jaw. Calculating the moving average of the jaw, it has been calculated by calculating the middle value of the smooth 13th period by 8 times. The red line in the calculation of the alligator index is the tooth. Calculating the moving average of the teeth, it has been calculated by calculating the middle value of the smooth 8th time by 5 times. The green line in the calculation of the alligator index is the lip. Calculating the moving average of the lip, it is calculated by calculating the middle value of the smooth 5th period by 3 times.

2.-Show how to add the indicator to the chart, How to configure the Alligator indicator and is it advisable to change its default settings ?. (Screenshot required)
How to add the indicator to the chart
I will add alligator index to the chart using trading analysis site https://www.tradingview.com/ to answer this question. Described with screenshots below.

Step1:-First of all Link you have to enter this link. After entering the link can be seen on the homepage of the tradingview site. Then click on the chart icon.

Step2:-Next you have to click on the indicator fx icon at the top of the chart.

Step3:-After clicking on the fx icon, search for Alligator Index. Then click on the William Index.

Step4:Clicking on the William Index adds the index to the chart. Similar to the screenshot above .
Configuration of the Alligator Indicator.

Screenshot Source
Step1:-To configure Alligator Indicator, first click on Alligator Indicator Settings.

Screenshot Source
Step2:-Then click on Inputs. The screenshot below shows the default settings for the Alligator index.

Step3:-Next you have to click on the Style icon. After clicking on the style icon you will see blue line for jaw, red line for teeth and green line for lips.

Screenshot Source
Step4:-Finally click on Visibility Settings. After clicking Visibility, the default settings pop up. Where we see seconds, minutes, hours, days, weeks, months. Then you have to click on the OK icon.
Is it advisable to change its default settings?
The default settings for the Alligator Index should not be changed at all. This setting is set by the research of technical analysts. We can never change the research of researchers because they take a lot of time to do a research. Moreover, the inputs of each moving average level are Fibonacci numbers. These Fibonacci numbers form important levels such as: support and resistance as well as when looking for market entry, these numbers are of immense importance. Mr. Bill Williams has chosen the default setting for the indicator in order for the business to be successful. Lastly the settings of the talk indicator cannot be changed.
3:-How do we interpret this indicator from its 3 phases: the period of rest(or sleep), awakening, and the meal phase? (Screenshot required)
We already know that the alligator index is based on the different behaviors of alligator animals. There may be three different phases of the indicator depending on the behavior. And then the resting stage, the waking stage and the eating stage. Basically the resting stage is when the lines come together. Again when the lines are disconnected is the stage of awakening and eating. However, the details are discussed below:
The Rest (or Sleep) Phase:
This is the resting stage of the alligator, at which point the alligator animal sleeps with three moving average lips, jaws and teeth together. No movement. That is, the three moving average rest periods do not overlap and are always intertwined. At this stage the alligator's mouth closes. After this time the market became very indecisive. Since the alligator is at rest, investors should also be at rest. Because rest period is not the right time for investors to do any kind of trade.

Screenshot Source
In the chart above, the averages of the three moving lines of the alligator indicator are intertwined with the blue border shown. When this situation arises in the chart, it is not possible to give any clear signal by the indicator. For this, investors should move away from the market without taking any position in the market at rest or sleep.
The Awakening Phase
From the name we understand that this stage of the alligator begins to wake up from sleep. Three lines widen during waking. Crypto traders usually look for the time to make a profit in their business and this stage is a good time to make a profit. At the waking level, cryptocurrencies give a signal of rising prices. The awakening phase is very important for all crypto traders.

Screenshot Source
In the chart above the average of the three moving lines of the alligator indicator is rising upwards which is shown by the blue border. This means that the alligator mouth has started to open and the alligator is ready for food. It also signals a rise in the value of crypto assets.
The Meal (Feeding) Phase
At this stage of the alligator the alligator is fully awake. The alligator is eating the food available to him at the food stage. We can present it with trends. Because in this phase the alligator is upward or downward. Also the face of the alligator is wide in this phase.

Screenshot Source
In the chart above we see within the blue border that the green line is above the blue line and the red line above all this means it indicates an uptrend. Again if there is a green line below the red and blue lines then it indicates a downtrend.
4:-Based on the layout of its three moving averages that make up the Alligator indicator, how can one predict whether the trend will be bullish or bearis.
With the help of Alligator indicator we can understand the market forecast. We know that the alligator indicator has three moving averages. As a result of this moving average we will be able to easily determine whether the movement is bullish or bearish. The following is how we can understand the market forecast with the help of this alligator indicator:
Bullish Trend
If we want to get the bullish trend signal with the help of Alligator indicator, we have to look at the green line first. That means you have to pay attention to the movement of the green line. The market bullish trend occurs when the green line crosses the red line and moves upwards and the red moving average is in the middle. And there will be a blue line under everyone. When the lines spread out in this way separately, it indicates that the trend is a bullish trend. As shown in the screenshot below.

Screenshot Source
The blue mark in the screenshot above shows that the green line crossed the red line . That means the bullish trend has started and the market is now upward.
Bearish Trend
Even if we want to get the bearish trend signal with the help of Alligator indicator, we have to look at the green line. This means that even in the case of bearish trends, you have to pay attention to the movement of the green line. The bearish trend in the market is when the red line crosses the green line and the blue line is above all. That means the red moving average will be in the middle. When the lines are scattered separately this way indicates that the trend is a bearish trend. As shown in the screenshot below.
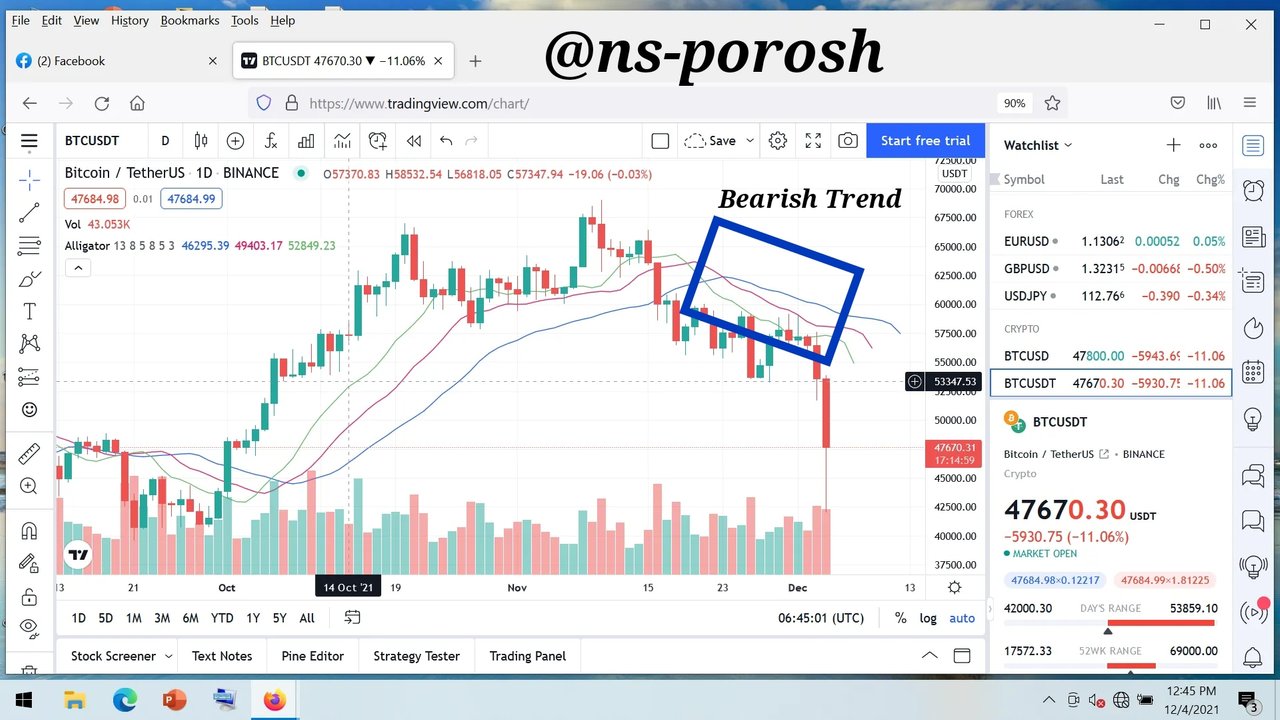
The blue mark in the screenshot above shows that the blue line is at the top and the green line has crossed the red line and gone down. Red is in the middle and green is down. This means that the bearish trend has started and the market is now down.
5:-Explain how the Alligator indicator is also used to understand sell / buy signals, by analyzing its different movements.
Typically every trader uses indicators to basically look for market forecasts and signals to buy and sell assets. The Alligator Index gives an idea of where a trader will enter his business and when he will buy and sell his assets. Traders can also use the indicator to identify entry positions on a chart. The details are discussed below.
Buy Signal
Traders can easily understand with the Alligator indicator when it is better for them to enter the market. Three different colored lines on the alligator indicator. When using the alligator indicator the time if the green line between the three lines crosses the other two lines and goes to the top. That is, when the green line is at the top and the blue line is at the bottom and the red line is found between the two lines, then the alligator indicator gives the buy signal to the traders. Basically this is the buy signal. Below is a screenshot of the buy signal.

Screenshot Source
If we take a closer look at the screenshot above, we can see that the green moving average is on top of the other moving averages. At this stage we can identify the buying signal in the market.
Sell Signal
When using the Alligator indicator, if we ever notice that the blue moving average of the three moving averages of the alligator indicator is above the other two moving averages, ie green and red, then the alligator indicator signals us to sell the asset. This is the Sell Signal. Below is a screenshot of the sell signal.

The screenshot above shows that the blue moving average is on top of the other moving averages. At this stage we can identify the sell signal in the market.
6:-Do you see the effectiveness of using the Alligator indicator in scalping trading style? Explain this based on a clear example.(Screenshot required)
Scalping refers to short-term trading. On a short-term trading platform, a trader can make numerous trades in one day. However, the duration of each trade is very short (only a few seconds). This means that due to the short duration of the trade, such traders can do a lot of trading in one day. Traders can make very little profit on scalp trading platforms. Moreover, traders do not disclose their position in the market for a long time on this platform due to which scalping trading is less risky.

Screenshot Source
In the screenshot above we can see that traders are trading in scalping style and in a short time buy or sell signals are being created. Traders follow these signals and make a small profit by buying and selling assets in the market. However, these small profits became huge profits.
7:-Is it necessary to add another indicator in order for the indicator to work better as a filter and help get rid of unnecessary and false signals? Use a graph to support your answer.
Basically no index is 100% accurate. Each indicator has some or the other error. There are also some errors in the Alligator index. No matter how accurate the alligator indicator, it is not 100% accurate. We know that Alligator Indicators always provide the correct and necessary signals but occasionally generate some erroneous and unnecessary signals. To correct this error I think the alligator indicator should be used along with the RSI indicator. The RSI index is much more accurate than other indicators. Using Alligator indicator with RSI indicator will filter out erroneous and unnecessary signals and will strengthen the reactive trend signal with correct result.

Screenshot Source
The screenshot above shows where the indicator has been created, meaning that the alligator indicates the indicator to bye-entry and that its clear spots match the movement of the RSI. Lastly I would like to say that a trader should use Alligator Index along with RSI Index to maximize his profits.
8:-List the advantages and disadvantages of the Alligator indicator
The advantages and disadvantages of Alligator indicator are given below:
Advantages
- 1:-The biggest advantage of Alligator Index is that it is easy to use and understand. A user can easily use and understand this indicator.
- 2:-Another great advantage of Alligator Indicator is that very few false signals are generated from this indicator and the indicator provides the best accurate signal to enter and exit the market.
3:-The indicator has different default settings. For example, when using Alligator Indicator, each user needs to check the signal three times and after checking the signal three times, the result is very accurate.
4:- A user does not need any complex technical skills to understand the alligator indicator. This is why this indicator is suitable for use in any market.
Disadvantages
- 1:-The biggest problem with Alligator Index is that it sometimes creates false signals and confuses traders.
2:-Another major drawback is that the alligator indicator is a lagging indicator for which the nature is very unstable.
3:-It also signals late most of the time.
Conclusion
I have gained a lot of knowledge about Alligator Indicator from this lecture of Sir which I did not have before. Aligator indicators are very easy to use and market predictions are easy to understand. The alligator indicator has three moving rest, waking and eating averages. It is possible to determine the market trend using this moving average. Alligator indicators also indicate when a trader needs to enter the market and when to leave the market. However, I will personally use Alligator Indicator and use other indicators along with Alligator Indicator for better profit. Thank you very much sir @kouba01 for this beautiful lesson.

Obhinandon kaka
Wow you really did a good job, more post from you ns_porosh, stay safe always🙂
Thanks
You're welcome ns-porosh 😊
You have been upvoted by @sm-shagor, a Country Representative of Bangladesh. We are voting with the Steemit Community Curator @steemcurator07 account to support the quality contents on steemit.
Follow @steemitblog for all the latest update and
Keep creating qualityful contents on Steemit!
Joining #club5050 for Extra vote.😊