[CRYPTO TRADING STRATEGY WITH MEDIAN INDICATOR]- Steemit Crypto Academy- Homework post for Professor @abdu.navi03 by @nishika
1-Explain your understanding with the median indicator.
Every traders in this world of cryptocurrency performs a technical analysis before entering into any trade. This analysis helps traders to carry and execute trades in a better way. There are many indicators which are used by traders to do so. One of them is the median indicator and I am going to talk about it.
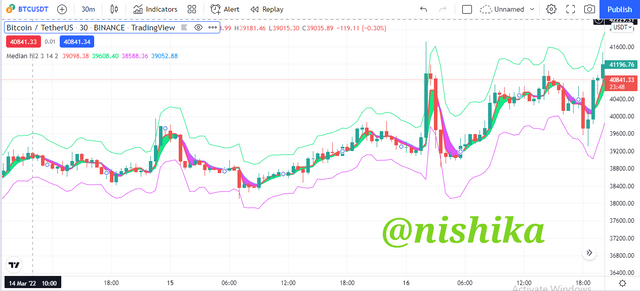
The median indicator works with the mathematical calculations which are based on ATR and EMA. The median indicator shows median bands and these bands move accordingly to price. Due to this, traders can determine the volatility of price and the uptrend and downtrend of price in a specific time period.
Median indicator - Tradingview
The indicator has two types of bands - Green band and pure band. The purple bands represents a bearish trend when median band crosses below ema and green band represents a bullish trend which forms when median band crosses above Ema. This is a trend based indicator and so traders use these signals to predict the market trend for placing buy and sell signals.
2 - Parameters and Calculations of Median indicator.
The median indicator has different parameters which are used to modify the indicator. Before going to the parameters, I am showing how to add the indicator on any chart. For this I am using TradingView platform.
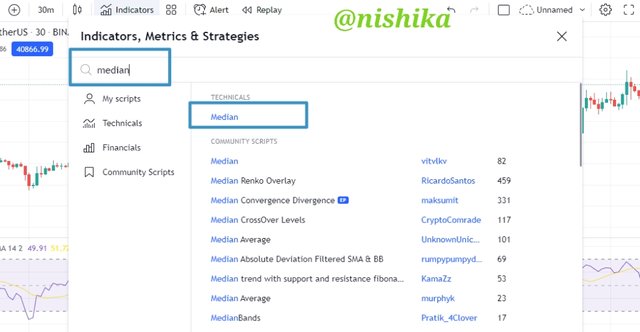
To add median indicator on chart, click on the indicators icon on the top of the chart which is shown in the image.
Then, the search bar appears. Type "Median" in the search bar and click on the first result. This will add indicator to your chart .
Parameters of median indicator:
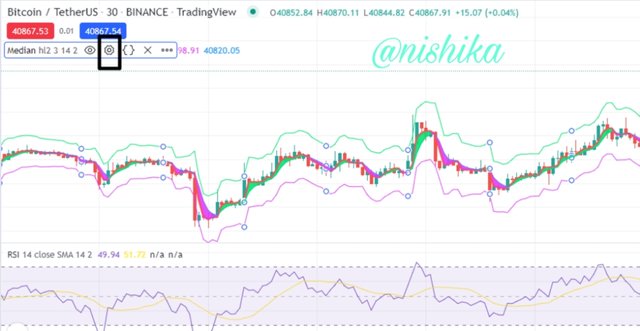
To go to parameters, click on the name of indicator and go to settings. This will shows parameters.
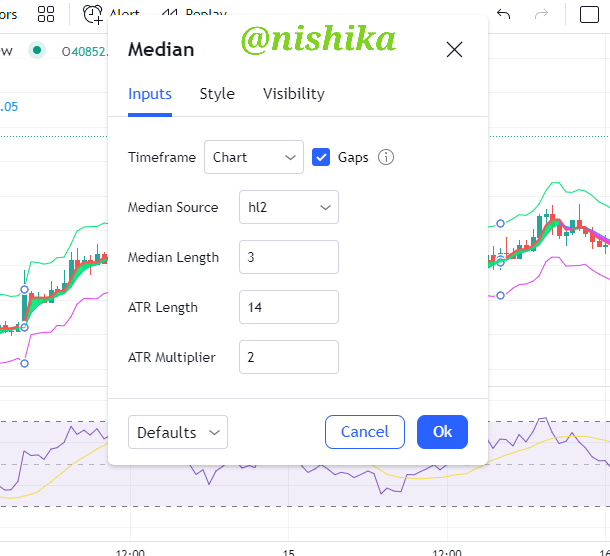
The first column is of Input, where you can modify the indicator according to your preference. We can modify timeframe, median length, ATR length and ATR multiplier. By default, the median length is 3 and ATR length is 14.
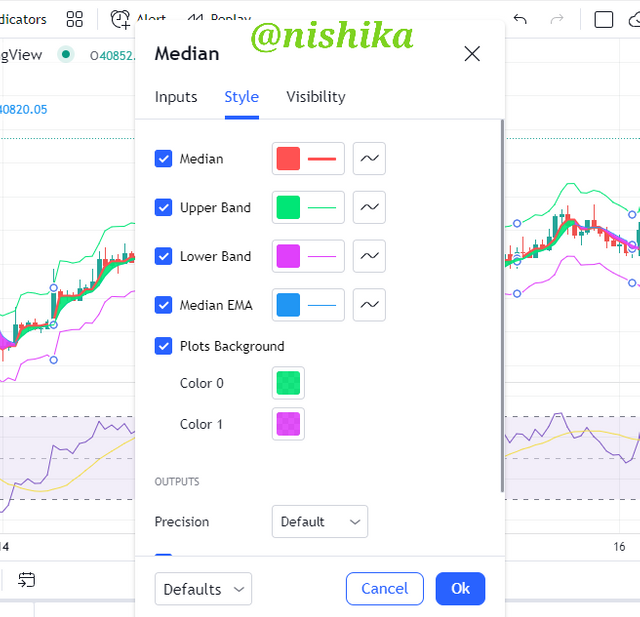
The second column is of Style where we can change the colour of Median, upper band, lower band to make to more attractive.
Calculation of Median Indicator:
The median indicator can be calculated by using the formula given below.
Value of median = (highest price + Lowest price) /2
EMA Value = (Closing price × multiplier) + previous Ema × 1-multiplier
Median indicator = % ATR change (Median value & EMA value)
where,
Median = ( Average price + ATR) / ATR
Upper Band = Median length + 2 ATR
Lower Band = Median length - 2 ATR
3- Uptrend from Median indicator (screenshot required).
As I have mentioned above already, that median indicator is a trend based indicator and so finding trends by this is very easy. Lets check how we can find the trend using the bands of median indicator.
First, select any chart on which you want to check the price trend and apply median indicator. Then check for the purple and green bands of median indicator. When a green band appreas with a median value above the EMA value, it indicates that there is a bullish trend. The appearance of green cloud Shows that we can take a buy entry at the point.
In the above chart, we can see that a green cloud has appeard at the marked points which indicates a reversal of trend from bearish to bullish and here I can take entry at the point I marked with the desired take profit and stop loss values.
4 - Downtrend from Median Indicator (screenshot required)
Similary like finding uptrend, we can also find a downtrend using median indicator and this is also easy as finding uptrend. Lets check how we can find the downtrend trend using the bands of median indicator.
First, select any chart on which you want to check the price trend and apply median indicator. Then check for the purple and green bands of median indicator. When a purple band appreas with a median value below the EMA value, it indicates that there is a bearish trend. The appearance of purple cloud Shows that we can take a buy entry at the point.
In the above chart, we can see that a purple cloud has appeard at the marked points which indicates a reversal of trend from bullish to bearish and here, I can take my sell entry at the point I marked with the desired take profit and stop loss values.
5- Identifying fake Signals with Median indicator(screenshot required).
Without the use of indicators, we cannot do the technical analysis for trade. But no indicator is 100% percent. However, the accuracy of an indicator can be increased by combining the indicator with any other indicator such as RSI. I am also using RSI indicator in combination with Median indicator.
This is very useful in finding out false signals. This also prevents the traders from taking wrong entry which helps the traders in minimizing their loss. There are two regions in the RSI indicator in which one is overbought region which is above from 70 and this shows a trend reversal from bullish to bearish. The other region is oversold region which is below from 30 and this shows a trend reversal from bearish to bullish.
In the above chart, we can see that the RSI indicator is in oversold region which represents that price is going to reverse from bearish to bullish. But if we look at the price, we see that the price is going down and down and it is not reversing to upward. This shows that the signal is false.
6 - Open two demo trades, long and short, with the help of a median indicator or combination that includes a median indicator (screenshot required)
Long trade:
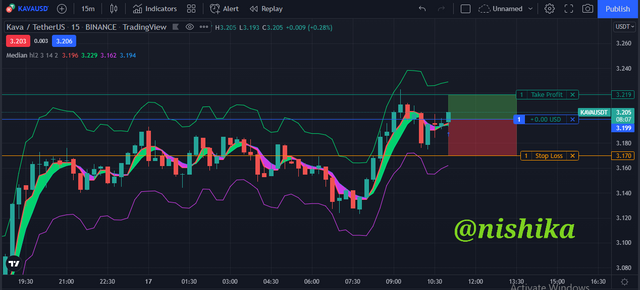
Here, i am going to do a buy trade in the 15 minutes timeframe chart of KAVAUSDT. The screenshot of asset is given below with the entry point at the level where a green band is formed showing a bullish signal.
In the image, we can see that I have marked the entry point at the price of $3.199 and i have applied take profit some region above the entry price and stop loss below the entry price. I will took the profit when green band will disappear.
Then, I have opened a long demo trade of abovr setup which is shown below.
Short trade:
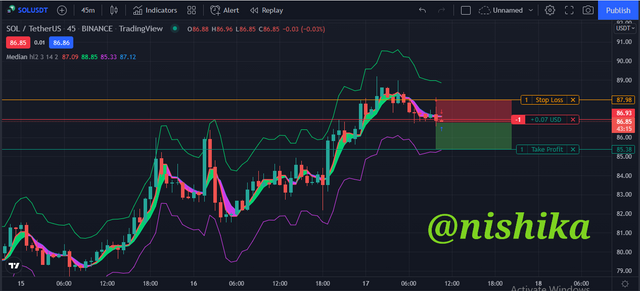
Here, i am going to do a sell trade in the 45 minutes timeframe chart of SOLUSDT. The screenshot of asset is given below with the entry point at the level where a purple band is formed and this showing a bearish signal.
In the image, we can see that I have marked the entry point at the price of $86.93 and i have applied take profit some region below the entry price and stop loss above the entry price. I will took the profit when purple band will disappear.
CONCLUSION
Median indicator is a trend based indicator and it is useful in finding entry and exit points. This indicator is used to filter false signals when it is combined with other indicators.
I have learnt much about median indicator from this lecture and I am thankful to professor @abdu.navi03 for making this interesting lecture.
