Steemit Crypto Academy Season 5 Week 1 [Beginner's Course] - Understanding Trends:
1) a) What do you understand by a Trending market?
b) What is a bullish and a bearish trend? (screenshot required)
Firstly if we observe closely, we would discover that there are two key words in the question, One of which is trending and the other market. Defining them separately from a layman understanding, we can say that a trend has to do with the current reigning probably a new development or a change.
While a market has to do with the buying and selling of a commodity in a specific area and at a given time.
A TRENDING MARKET is an arena that comprises of both the market and the trend where by the asset or security moves in a pattern either ascending or descending . whereby in an ascending trend, the price ensures to close at a high above the previous high. similarly in the descending trend, the price ensures to close at a low lower than the previous low.
Having an awareness of the trend is a great advantage as it helps speculate a good entry and a lovely exit.
b) What is a bullish and a bearish trend? (screenshot required)
If you were a bit attentive, you would notice that I made mention of and ascending and descending trend, it can also be called upward and downward trend, it can also be called a bullish and a bearish trend. so I will be explaining below what they both mean.
BULLISH TREND
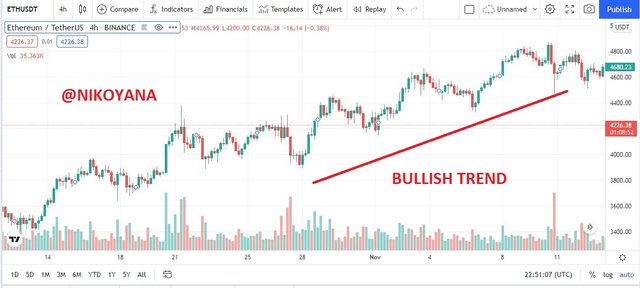
If you have ever seen the image of a bull or you have been oppourtuned to watch a bull fight, you will discover that the horns are always faced up. in simple terms, a bullish trend is an ascending or upward movement of a trend within a period of time.
It is highly important to learn that a little retracement in the movement of an asset doesnt mean a reversal as the asset can continue in the same bullish trend after the retracement
Below is the chart of ETH/USDT on a 4hr timeline giving us an example of a bullish trend
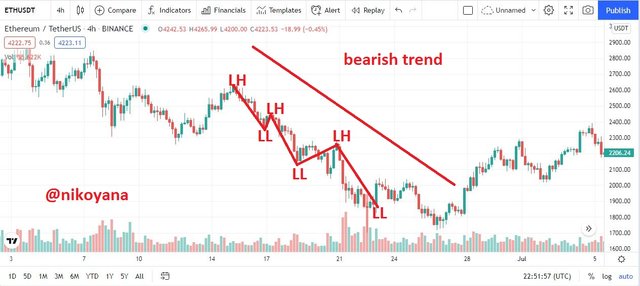
BEARISH TREND
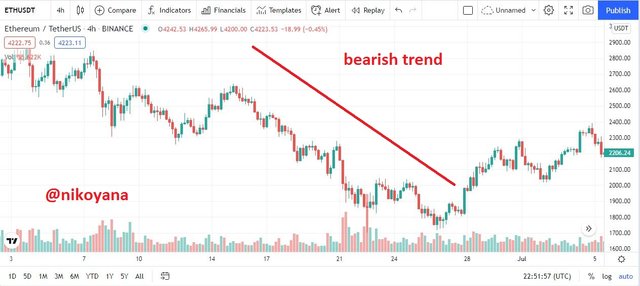
I really dont have an illustration to give about the bear but one thing I know is that a bear is timid always backing out in the presence of danger. In this case we refer to the bearish trend as a downward movement or descending movement with respect to the time being illustrated on the chart.
It is highly important to learn that a little retracement in the movement of an asset doesn't mean a reversal as the asset can continue in the same bearish trend after the retracement
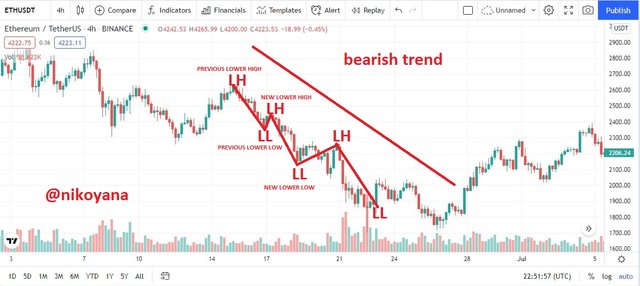
Below is the chart of ETH/USDT on a 4hr timeline giving us an example of a bearish trend

2) Explain the following trend identification and give an example of each of them. (Original screenshot needed from your chart). Do this for a bullish and a bearish trend.
i) Market Structure.
ii) Trendlines
Having known what a trend means and the different kinds of trend, it is largely important to know that there are trend identificators which help us identify both the bullish and the bearish trend.
MARKET STRUCTURE
Market structure is a pattern in which we use to identify the trend of an asset be it ascending or descending or bullish or bearish. I will be showing us the market structure using the bullish and bearish pattern.
BULLISH PATTERN(MARKET STRUCTURE)
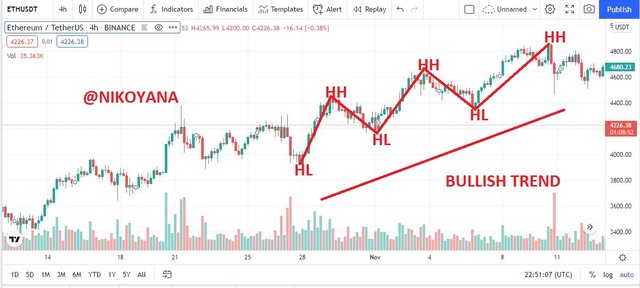
In the bullish pattern of the market structure, we can see a progressive zigzag in an upward motion. that consists of higher high denoted by (HH) in the chart below and a higher low denoted by (HL) in the chart below where by the new higher high is always higher than the previous higher high.
BEARISH PATTERN(MARKET STRUCTURE)
In the bearish pattern of the market structure, we can see a progressive zigzag in a downward motion. that consists of lower high denoted by (LH) in the chart below and a lower low denoted by (LL) in the chart below where by the new lower low is always lower than the previous lower low.
TRENDLINES
A trendline in the crypto market is a line drawn which comprises of several highs and lows that touches the trendline to either create a resistance or a support. I will be showing examples for a bullish or a bearish trendline.
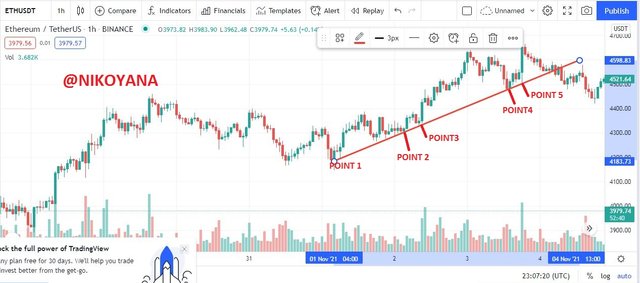
BULLISH TRENDLINES
This pattern is used by investors and analyst to determine a support for an asset or security that they wish to watch. it is gotten by drawing a line across the trend and we pick points of the higher low which touches the line and bounces up to continue the trend. below an example of the bullish trendline chart.
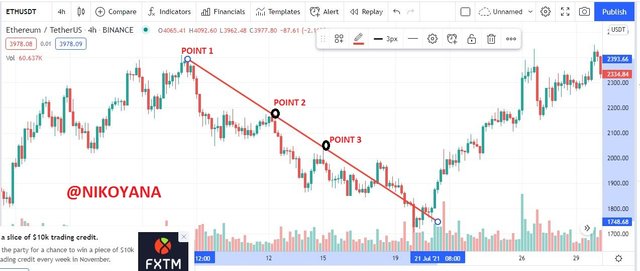
BEARISH TRENDLINES
This pattern is also used by investors and analyst to determine a resistance for an asset or security that they wish to watch. it is gotten by drawing a line across the trend and we pick points of the lower high which touches the line and bounces down to continue the trend. below an example of the bearish trendline chart.
3) Explain trend continuation and how to spot them using market structure and trendlines. (Screenshot needed). Do this for both bullish and bearish trends.
Trend continuation is the continuation of a trend in a specific pattern over a timeframe or a period of time. no chart from all I have seen since I got familiar with the crypto currency chart moves in a straight line. there are usually ups and downs which we call retracements and after which the trend continues in it's original pattern.
As required I will be explaining the criterias for a trend continuation using both the market structure and the trendline.
MARKET STRUCTURE (TREND CONTINUATION)
BULLISH TREND
In the bullish trend, a trend continuation signifies that buyers are in control over the sellers. the trend moves in a zigzag manner having a series of higher high and higher low and in this case the new higher high is always higher than the previous higher high
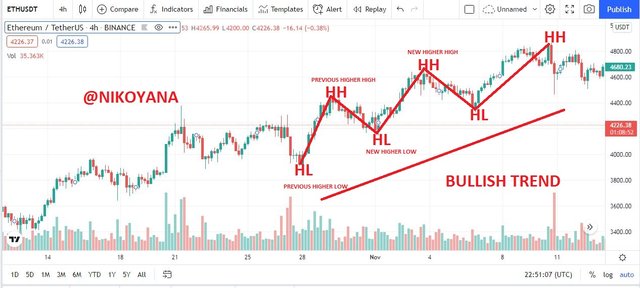
If we look at the chart above, we will observe two notable facts
- The new higher high is always higher than the previous higher high
- The new higher low is not lower than the previous higher low
Any contradiction to the rules above will consider the trend continuation invalid.
BEARISH TREND
In the bearish trend, a trend continuation signifies that sellers are in control over the buyers. the trend moves in a zigzag manner having a series of lower high and lower low and in this case the new lower high is always lower than the previous lower high
If we look at the chart above, we will observe two notable facts
- The new lower high is always lower than the previous lower high
- The new lower low is lower than the previous lower low
Any contradiction to the rules above will consider the trend continuation invalid.
TRENDLINE (TREND CONTINUATION)
A trendline like I said before is a line drawn which comprises of several highs and lows that touches the trendline to either create a resistance or a support. I will be showing examples for a bullish or a bearish trendline in a trend continuation.
BULLISH TREND
In this aspect it is important to note that this trend is gotten by drawing the trend line as a support and the higher lows bounces on the trendline and continues in the upward trend pattern. it would be amazing to note tha the bouncing up point is a point for a good entry. below is a chart of the bullish trend.
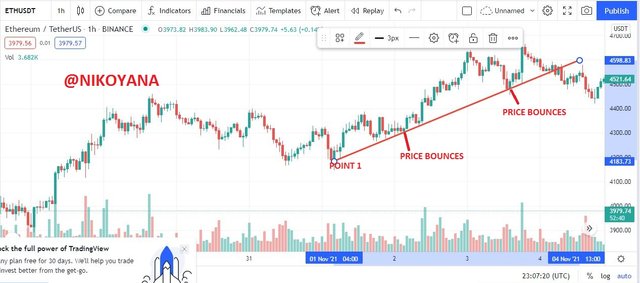
If we look at the chart above, we will observe two notable facts
- as soon as the price touches the line it is being counted, points that do not touch the lines are not counted
- As soon as the price breaks the through the line the trend continuation set up is broken
BEARISH TREND
In this aspect it is important to note that this trend is gotten by drawing the trend line as a resistance and the lower high bounces on the trendline and continues in the downward trend pattern. it would be amazing to note that the bouncing down point is a point for a good exit. below is a chart of the bearish trend.
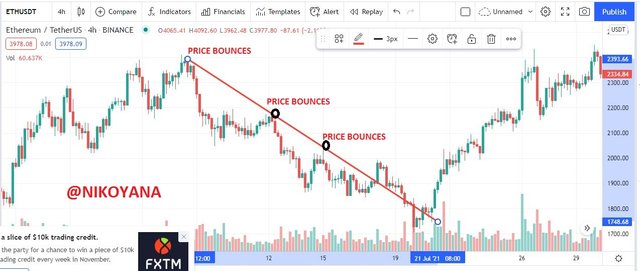
If we look at the chart above, we will observe two notable facts
- as soon as the price touches the line it is being counted, points that do not touch the lines are not counted
- As soon as the price breaks the through the line the trend continuation set up is broken
4) Pick up any crypto-asset chart and answer the following questions-
i) Is the market trending?
ii) What is the current market trend? (Use the chart to back up your answers)
i) Is the market trending?
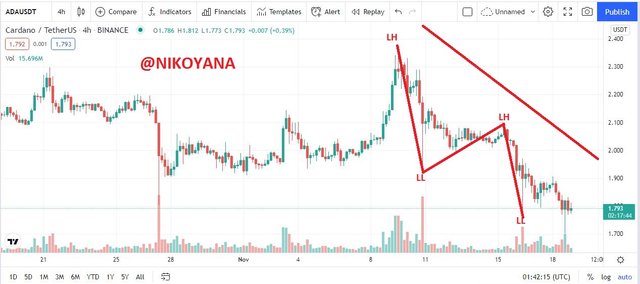
In this section I will be making my analysis using the ADA/USDT chart on a 4hr timeframe, as we can see the chart being analysed using the market structure and we can see that the chart is on a bearish trend, so the answer is YES because the asset is trending in a bearish pattern
ii) What is the current market trend? (Use the chart to back up your answers)
The current trend of the market is a BEARISH TREND looking at the chart below, we can see that the trend is moving in a downward motion, we also can see the retracements and the lower high and lower lows on the chart showing how accurate the bearish pattern.
CONCLUSION
It was a great lecture delivered and so far so good, I have answered to the best of my understanding. I have learnt greatly about the trends and all it stands for.
The market structure and the trendline being a great indicatord for investors to note good entries and exit.
Lastly, I would love to be taking the part 2 of this lecture next week. thank you all for going through my post, see you next week.
Lovely regards
@reminiscence01
Hello @nikoyana , I’m glad you participated in the 1st week Season 5 of the Beginner’s class at the Steemit Crypto Academy. Your grades in this task are as follows:
Recommendation / Feedback:
Thank you for participating in this homework task.
@steemcurator02