How to Trade Cryptocurrencies Profitably Using TD Sequential]-Steemit Crypto Academy | S4W8 | Homework Post for @reddileep
 designed by me from photoshop
1- Define TD Sequential Indicator in your own words.
Have you ever been praying for a price trend change just you could make a little profit from it?, God has answered such prayer with the aid of an indicator created by Tom DeMark. and that indicator is called the TD Sequencial
the TD sequential indicator is an indicator that recognises or picks out a reversal or turning point in the price trend(upwards or downwards) of a security or asset. It helps to indicate an extended price move that is about creating a price reversal in the opposite direction prior to its initial direction.
the TD sequential indicator also helps to create a support and resistance for the market trend, used better on a candle stick pattern
2- Explain the Psychology behind TD Sequential. (Screenshots required)
The The TD sequential indicator which is used to detect reversal or correction in the market is very useful for traders as most traders usually look for reversal to enter a trade in the market inorder to get a higher margin of profit.
There are two(2) major phases of the TD sequential indicator
- set up phase
- count down phase
the SetUp Phase involves all the pre-requisite required for one to properly detect a trend that will reverse. there are two types of the set up phase which is the sell setup and the buy setup
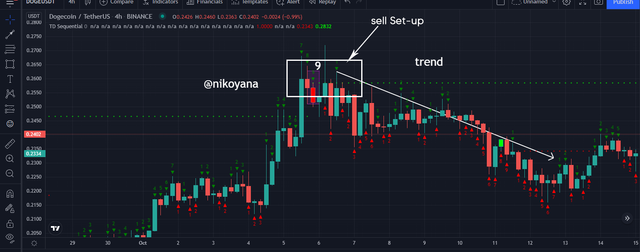
Sell Setup Phase: In the sell setup phase the trend of the market should be on an uptrend with the numbers ranging from 1-9 on the candle stick as soon as the number gets to 9, it is an indication for a sell reversal in the market.
Buy Setup Phase
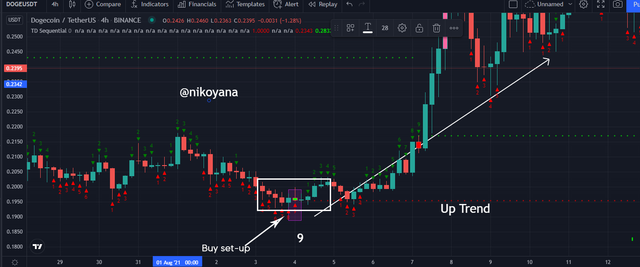
The buy setup talks about all the organisation that the TD indicator uses to determine a buy but initially the trend should be on a down trend with the numbers 1-9 properly arranged on the candle stick, it is an indication for a buy reversal in the market.
I will be giving more explanation about the sell and the buy setup in the subsequent questions
The count down phase is also used for reversal, but this phase happens when the setup phase doesnt give us the reversal then the countdown phase can come into play because the setup phase consist of 1-9 candlestick and most times the candlestick moves in an unexpected direction that causes the formation of the reversal on the setup phase not to be properly arranged. So we have to count further from number 9- 13 and sometimes the reversal might happen on the 13 candle which is a proper definition of the countdown phase. this might be an upward trend or a downward trend
3- Explain the TD Setup during a bullish and a bearish market. (Screenshots required)
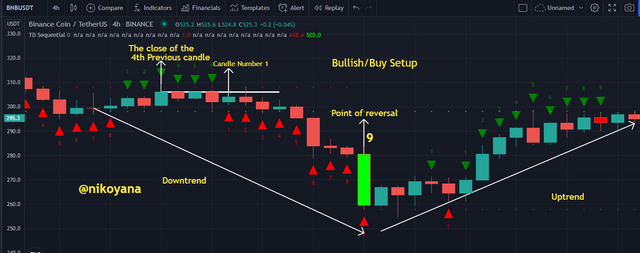
BULLISH SETUP
For the bullish setup the price must be a downtrend
The candle 1 must close below the close of the fourth previous candle, if candle 1 closes below the fourth previous candle we can indicate with a line
Candle 2 must also close below the fourth previous candle, same goes others until the 9th candle. As soon as we get to the 9th candle, we dont just execute a buy order, we look at the next candle,
if the next candle closes above the close of candle 9, it is a clear indication for a buy set up but if the candle after the candle 9 closes below the close of candle 9, we can commence the countdown phase watching upto candle 13 for the buy set up.
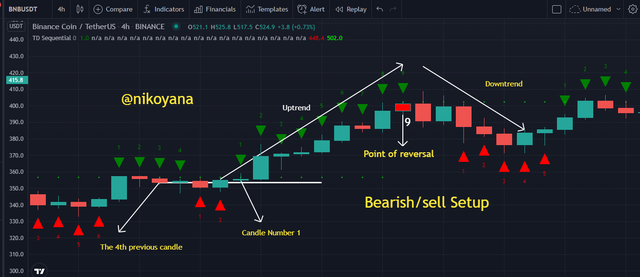
BEARISH SETUP
- The price must be on an uptrend
candle 1 must close above the close of the 4th previous candle, we can also use a line to confirm it
then the 2nd candle along till the 9th candle must close above the close of the fourth previous candle.
as soon as we get to the 9th angle we dont just execute our sell, if the next candle after the 9th closes below the close of the 9th candle stick, it is a clear indication for a sell set up but if the candle after the 9th one closes above the close of the 9th candle stick, we can commence the countdown phase watching up to candle 13 for the sell setup
4- Graphically explain how to identify a trend reversal using TD Sequential Indicator in a chart. (Screenshots required)
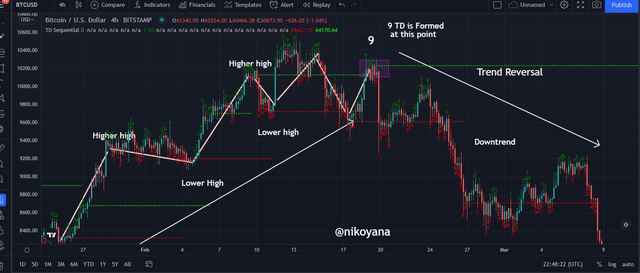
From the image above in the BTC/USDT chart on a 4hrs time frame we can see a lot of higher highs that the chart was making in an uptrend and due to the formation of the sell setup of the TD Sequential indicator, it lead to a reversal. if we look closely at the chart, we can see the formation of the 9th candle stick and after that was when the reversal started.
The formation of the 9th candle stick was initiated when the close of candle 1 is higher than the close of the fourth previous candle stick and the close of candle 2 is also higher than the previous candle this sequence repeated for candle 3 to candle 9 still on an upward trend.
When it got to candle 9, the trend changes in a downward direction and the close that was formed after candle 9 was lower than the close of candle 9. which is a clear indication of a trend reversal and we can see it from the chart above
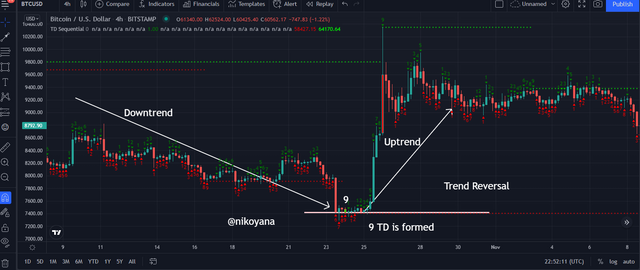
From the image above on a chart of BTC/USDT on a 4hr time fram, we can see firstly the trend moving in a downward direction with a lot of lower lows until it got to a point which indicated that the 9th count of the TD sequence indicator is formed showing a reversal point which made the trend to change direction upwards.
In order to get the first count, the close of the 1st count must be below the close of the previous 4th count which should take repeated turns for the 2nd,3rd,4th and even up to the 9th count inorder words, the close of the 2nd count till 9th count should be below the close of the 4th previous count.
When it got to candle 9, the trend changes in an upward direction meaning the next close of the candle after the 9th candle must be higher than the 9th candle creating an authentic reversal. And we can see from the image above we can see how the reversal went higher showing a clear trend change.
5- Using the knowledge gained from previous lessons, do a better Technical Analysis combining TD Sequential Indicator and make a real purchase of a coin at a point in which TD 9 or 8 count occurs. Then sell it before the next resistance line. (You should demonstrate all the relevant details including entry point, exit point, resistance lines, support lines or any other trading pattern such as Double bottom, Falling wedge and Inverse Head and Shoulders patterns.)
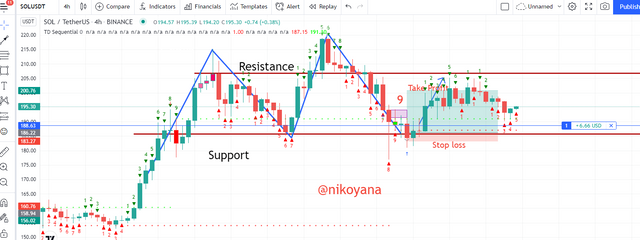
In a SOL/USDT chart on a 4hr time fram, the support was formed where more than one point relaxed or rested on the support and the resistant was also found. If we look closely we can see that an inverted W was also formed.
The price was also on the support when I initiated the trade which was the 9th candle stick count on the TD sequencial indicator, and this made the buy order to be a legitimate one.
I placed my stop loss directly below the support with a risk: reward ratio of 2:1, I placed my take profit ahead and luckily for me, the trade gave me profit earlier than I expected. this shows that the TD sequential indicator is a Top notch indicator as soon as it got to the resistance, I sold and we can see that my profit for the buy order reduced showing that it obeyed my support and resistance at the same time. Below is the result of the trade

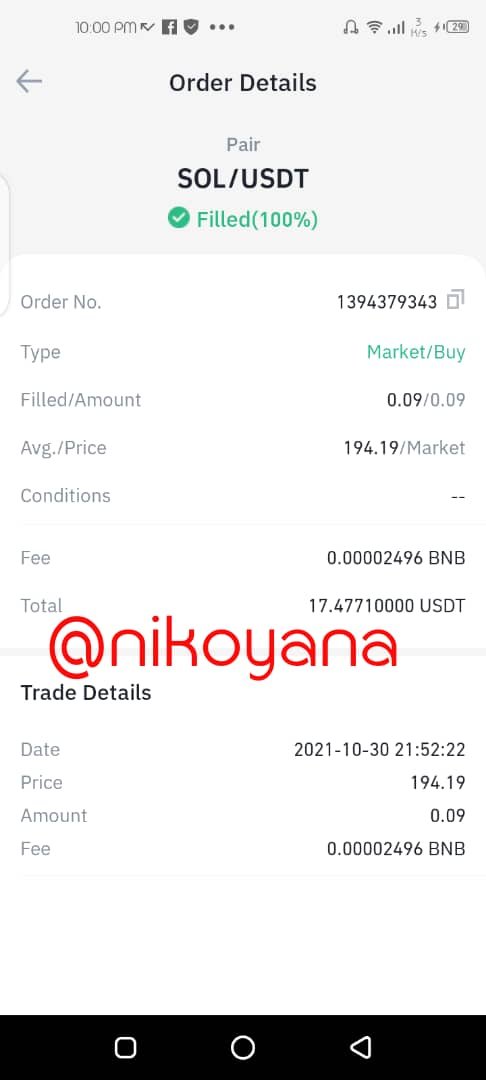
Also as instructed, I made a purchase of the SOL/USDT coin from my binance making a purchase of 17.59 USDT
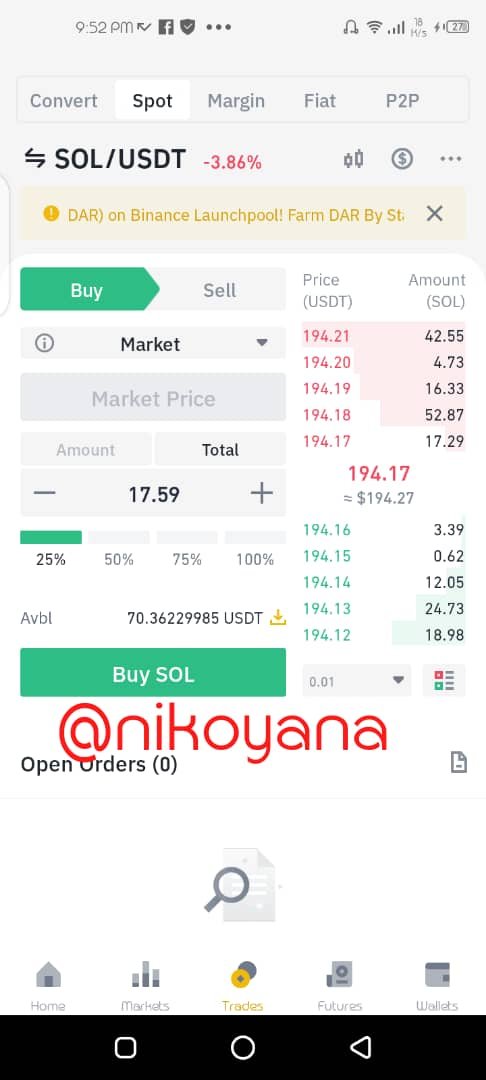
below is the details of the purchaed SOL coin.
CONCLUSION
I think the TD Sequential is a great indicator for me I would say its one of the best I have been taught on this platform, very easy to comprehend and easy to use. I really learn alot and I am grateful for that
all images gotten from tradingview and binance
Best Regards
@reddileep