Trading Strategy with Median Indicator - Steemit Crypto Academy |S6W4| - Homework Post for Professor @abdu.navi03


QUESTION 1
Explain your understanding with the median indicator.
This is a trend-based and catching indicator of the market which has a vital role as it estimates the direction and volatility of the market. As such, it forms a channel based on how the Average True Range ATR deviates from the middle of this range. For the specified length, it displays the median value of the average between highs and lows. It is made of up a thick median line, which acts as a moving average composed of two colours (green and purple) while indicating whether he market is bullish or bearish. This green band usually appears when the EMA sees the median line passing above it, and the purple band appears too when the median line passes under the EMA all of same length.
QUESTION 2
Parameters and Calculations of Median indicator. (Screenshot required)
The important parameters or settings that have to be taken into account concerning the Median indicator are listed as such;
- As earlier discussed, this indicator is guarded by bands that are focused on the Average True Range. In order to calculate these bands, the ATR value that designated for a certain ATR length is multiplied by the ATR multiplier, and added or subtracted from the median.
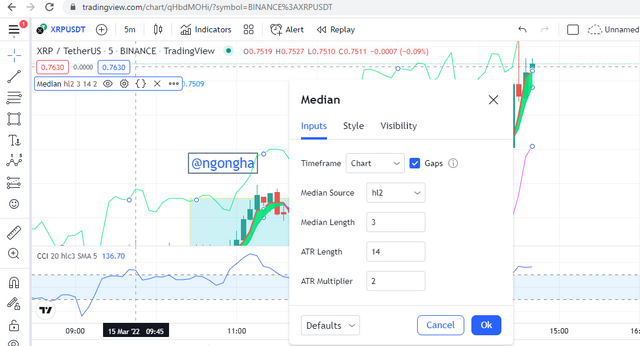
This screenshot above has key notes which are indicated below;
Median Source: It refers to the data source on which the median is calculated.
Median Length: It refers to how many data points of source are actually used when calculating the median.
ATR Length: It refers to the actual time period to be operated when the ATR is to be calculated.
ATR Multiplier: Refers to the actual value to which the ATR is multiplied before the bands are formed.
To calculate the bands, the following rules are employed;
- Upper band = Median Length + 2 * (ATR)
- Lower band = Median Length – 2 * (ATR)
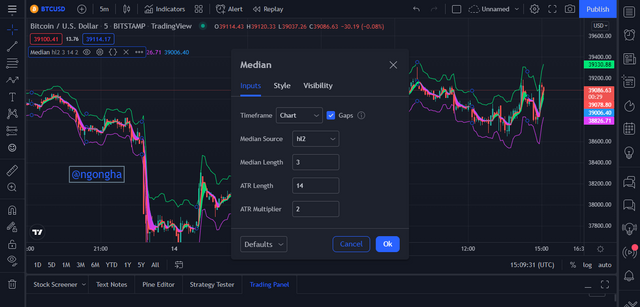
It should be taken into account that the displayed settings are default and can be modified based on the preference of the trader. Though it can be manipulated by different traders, it should be taken into consideration that incorrect inputs of these values can disturb the proper functioning of this indicator and thus giving false signals.
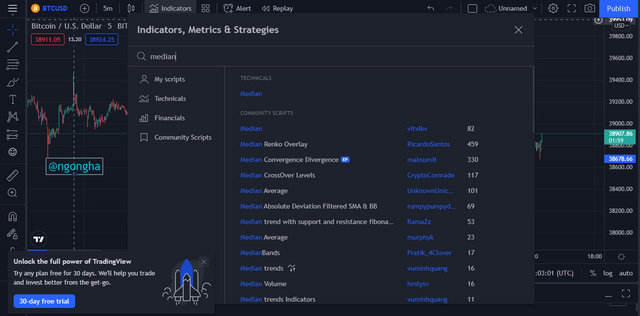
To insert the Median indicator, we hover around the “indicator” panel and search. I am doing this using the tradingview interface.
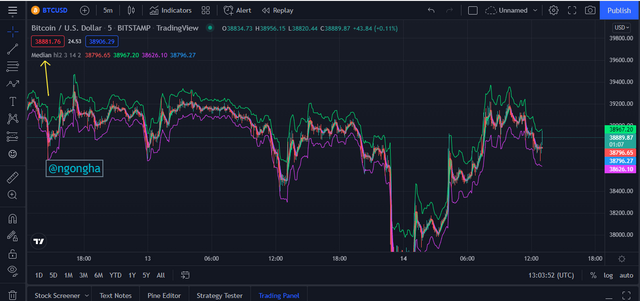
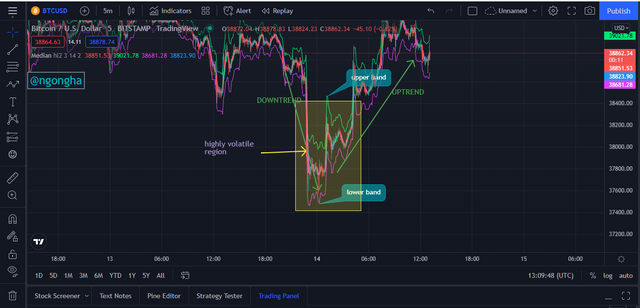
Below is an example of the important identities to notice about this chart and indicator.
It explains vividly the regions of the lower and upper bands, the regions of volatility, the wide spread between the bands in regions of high volatility and also seen how they are closer together in regions of lower volatility.
QUESTION 3
Uptrend from Median indicator (screenshot required)
The buying of an asset is given by a trending signal as this indicator trades trends. This means that most of the money reaped off a market is carried out when the market is trending.
This is seen below;
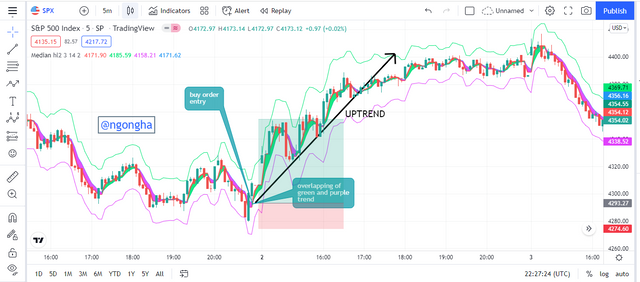
It is observed that when the candlestick becomes green, it signals a bullish trend. The appearance of the purple band indicates that the trend is about to come to an end and proper management skills such as the stop loss and take profits should be set.
QUESTION 4
Downtrend from Median Indicator (screenshot required)
In the same way in which we can use this indicator to generate a buy signal, a sell order can also be set up for a trade. An example of a bearish indication is seen below;
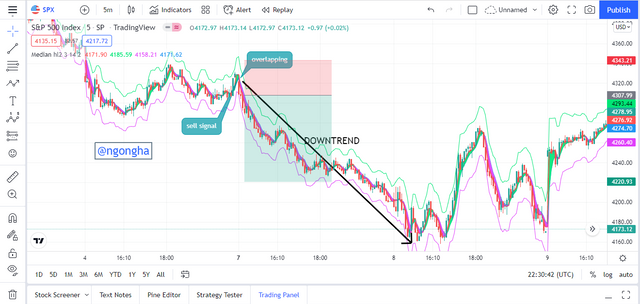
Above vividly shows the combination of the Median indicator with the change in trend of the candlesticks found in the BTCUSD chart shown.
QUESTION 5
Identifying fake Signals with Median indicator (screenshot required)
In all markets, it is imperative to witness signals that are not true at the moment of an asset’s chart. In order for traders to minimize the trap of falling into these scenarios, the Median indicator can be used as a gauge to filter out another indicator. The Median indicator below can be used to filter out the false indicators of the RSI indicator.
QUESTION 6
Open two demo trades, long and short, with the help of a median indicator or combination that includes a median indicator (screenshot required)
I will love to open two demo trades, a buy and a sell as instructed by the professor using this indicator in addition to the RSI indicator. The analysis will be done on the tradingview platform and the trades run on the MT4 application.
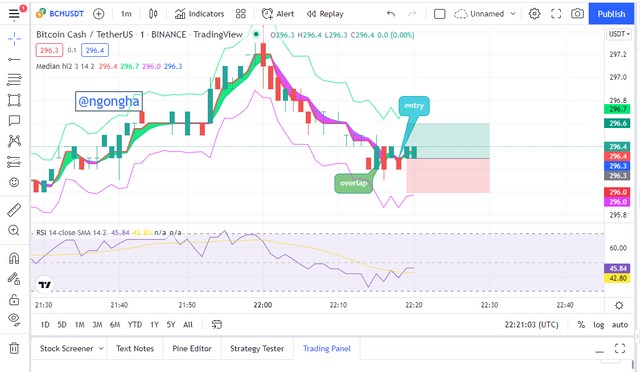
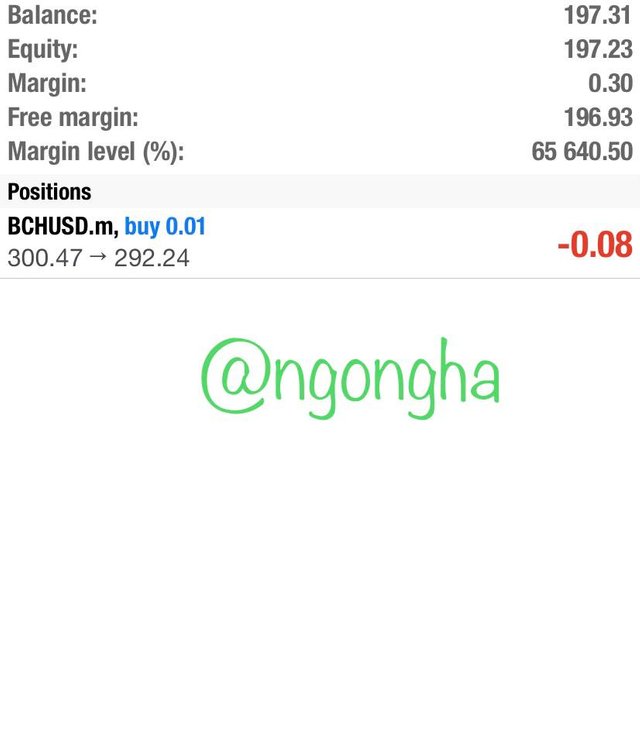
Long trade of the BCHUSDT pair
As the chart is seen below, after I noticed an overlap of the purple and green bands, and the corresponding RSI value was rising towards the 50 level, I initiated a buy order which resulted to the appearance of greenish candlesticks which is an indication of a trend reversal and serves as a chance to buy. The chart analysis and the orders are show as such;
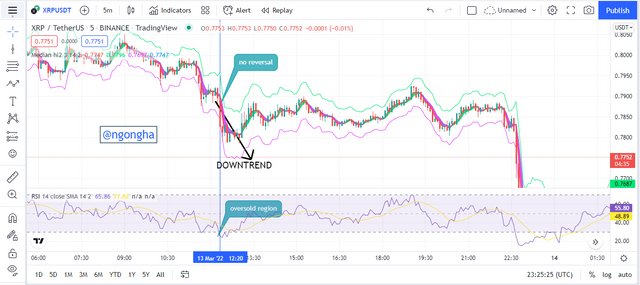
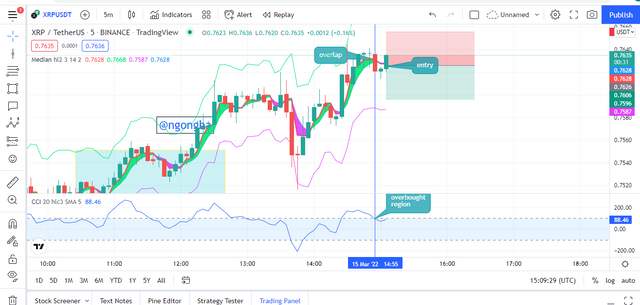
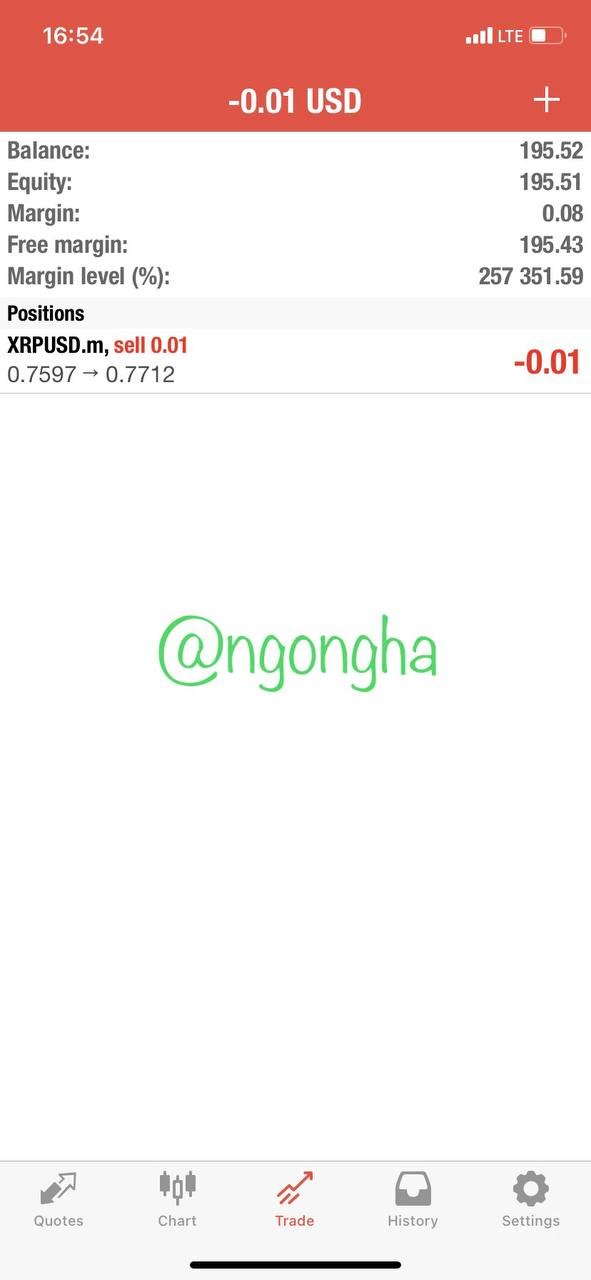
Short trade of the XRPUSDT pair
As portrayed, an overlap was waited between the green and purple bands, and as such the sell order was then waited to be executed. A further confirmation was then seen on the RSI indicator which was at the overbought region signaling a downtrend.
In the same way as above, the chart analysis and orders are shown as such;
CONCLUSION
This post talks on the median indicator, as it being a trend-based indicator and on how we can use it to obtain profitable signals be it in a bullish or bearish trend. It also talks on how we can use it to filter out false signals input by other indicators in the market as no single signal is perfect.
For the purpose of this post, I have combined the median indicator with the RSI as a signal works better when combined with another. This has been a very interesting write up as I have learnt a golden indicator once again.
ALL IMAGES USED HERE WITHOUT REFERENCE ARE ALL SCREENSHOT FROM tradingview.com
I wish to heartily thank Professor @abdu.navi03 for this intriguing work.
CC:
@abdu.navi03