Crypto Trading Strategy with Triangular Moving Average (TRIMA) Indicator - Crypto Academy / S6W4 - Homework Post for @fredquantum.


QUESTION 1
What is your understanding of the TRIMA indicator?
The acronym TRIMA actually stands for Triangular Moving Average. It represents a mean of prices of an asset, but indulges more on the prices on the middle of the suggested time period. The data is double-smooth using a window width which is one-half the series length. The talk on the TRIMA is never complete without the introduction of the Simple Moving Average SMA from which it takes reference. This SMA takes the average price of an asset and its line moves on about the chart positioned based on the mean value taken at that time. In a complex modification to this is the TRIMA, which is average two times in order not to react to the market hastily at any price fluctuations. This is the advantage of the TRIMA over the SMA as the latter reacts fast to any price movement.
The TRIMA is represented on a chart with a smoother wavelike pattern as it eliminates the quick reactions other indicators have to markets that are grossly volatile. Also, due to this simplicity of view, it clearly shows the existing trend of an asset permitting traders to identify the trend and execute or close off trades.
Other important points to consider about the TRIMA indicator are seen above;
- The TRIMA will not react swiftly in volatile market conditions, this implies it will take a longer while before the TRIMA line to change direction.
- TRIMA shows the average price of a given asset over a given number of data points which is usually a number of price bars.
- Its purpose is to double-smooth the price data, which produces a line that does not react as quickly to a price movement as a SMA would.
- A clearer trend indication is observed which is very much beneficial to trend traders.
QUESTION 2
Setup a crypto chart with TRIMA. How is the calculation of TRIMA done? Give an illustration. (Screenshots required).
Chart Setup
I will like to list the steps in which the TRIMA indicator can be inserted in a chart using the tradingview interface as seen;


As seen above, once the chart is opened, we can go to the indicators icon which has been shown with a yellow indicator to insert the indicator. When clicked, a search panel is shown where if we love, we can insert the TRIMA indicator by typing in full “triangular moving average” and the results are displayed.
Modifications to this indicator can be done depending on the preference of the trader as seen below;


TRIMA Formula calculation
The foundation of the TRIMA is the SMA as it is modified to produce the TRIMA. This gives us a double average of an asset’s price thus double-smoothing the trend. Thus, in the calculation of the TRIMA, it is but imperative to insert the SMA.
SMA: (P1 + P2 + P3 + P4 +... + Pn)/n.
Where
P1-4 : Asset’s price of its consecutive 4 periods.
Pn : Asset’s price taken at last period under consideration.
n : the total number of periods considered.
Above is the formula used to generate the SMA, we then just need use it in the calculation of the TRIMA
Which is the Sum of SMA values divided by the number of periods best represented mathematically
TRIMA : (SMA1 SMA2 SMA3 SMA4 + … + SMAn )/n
QUESTION 3
Identify uptrend and downtrend market conditions using TRIMA on separate charts.
Depending on the settings input by the trader, it depends solely on them on whether or not they witness an uptrend or downtrend in time to execute a trade. The complexity here right now is that; short periods are likely to remain attached to the price and does not give a broadened view of the entire market. Longer periods on the other hand take a lot of time to determine the direction of the market, thus tends to lag as observed by some traders. So, just the RIGHT period solely dependent on a trader’s strategy is needed.
In an uptrend
Here, the chart is crossed by the TRIMA and the price of the asset is seen above the TRIMA line. A trader can decide to open a buy position if this blessed opportunity presents itself with an obvious stop loss and take profit initiated. An example of this is shown as such;

It is clearly seen that after the TRIMA line had crossed the chart and was rising as prices were found above it, a couple of bullish candlesticks were waited on to appear before an entry was made with a take profit and stop loss set at the convenience of the trader.
In a downtrend
As the direct opposite of an uptrend, the downtrend proposes a mirrored case. Here, the chart is crossed by the TRIMA indicator and the prices of the assets are shown below the line. This is a reaping opportunity for trend traders as they can position themselves with ease and leave at their preferred moment. The line in this case is angled downward which is opposite to the upward angled inclined line found in an uptrend. An example is shown;

QUESTION 4
With your knowledge of dynamic support and resistance, show TRIMA acting like one. And show TRIMA movement in a consolidating market. (Screenshots required).
How the TRIMA acts as a dynamic support and resistance
It is well known that the notion of support and resistance is vastly important in trading as they provide a means by which traders can understand the “floor” and “ceiling” prices for a certain asset.
It is called dynamic here because it is not as our traditional horizontal support and resistance lines or zones as they constantly change depending on fresh price action.
Thus, we will dive in to explore how we can use the TRIMA to weigh in as a dynamic support and resistance.
As a support

With respect to the screenshot pasted above, it is observed that the TRIMA indicator set itself up as a support zone whenever the market reached it at these points as they retested the zones and bounce right up. They are similar to our normal support and resistance hence it is important to note that prices won’t always bounce from this TRIMA as seen. It might sometimes go past it a little further before it heads in trend direction or other times can just blast past it.
As a resistance
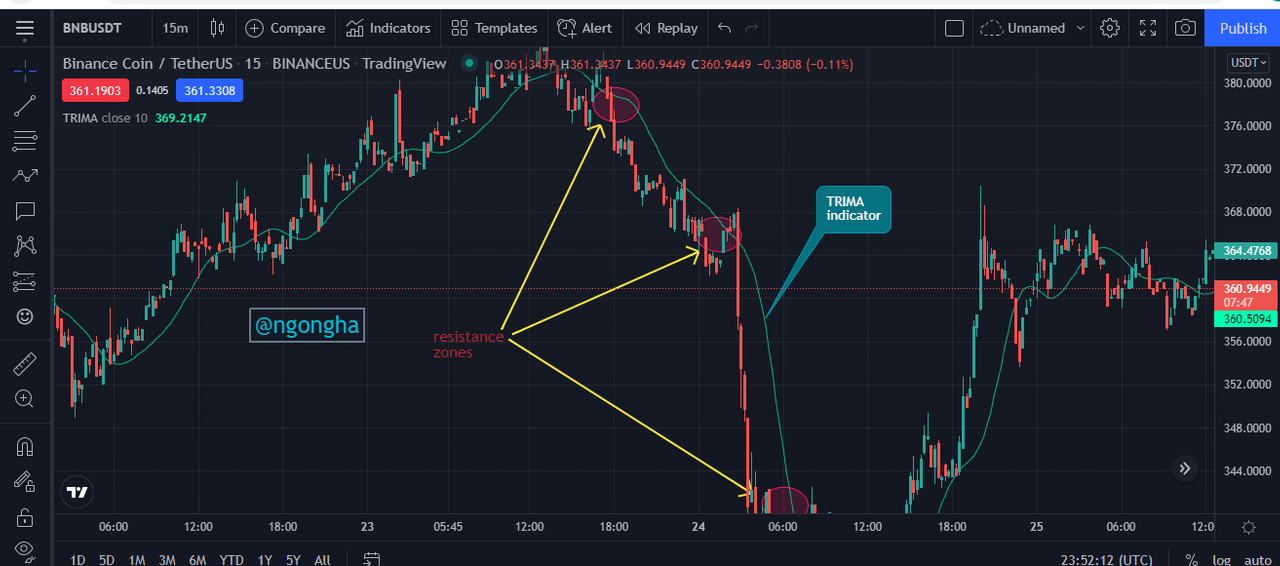
Here is a case where the TRIMA indicator is used as a resistance level for the BNBUSDT chart prices as shown. Whenever, the prices reached these highlighted regions, they were unable to close above it and as a result continued their downtrend.
TRIMA movement in a consolidating market
In situations where there is not an evident uptrend or downtrend, the market is said to be consolidating. In these situations, the TRIMA indicator is observed to be moving about the price of the asset as the actual trend of the market is not clear. Below is an example of the reaction of the market in this scenario;

We can witness the TRIMA indicator swindling around the prices of the asset as it has no trend certainty. This happens until eventually the bears have an upper hand in the duel leading to a downtrend.
QUESTION 5
Combine two TRIMAs and indicate how to identify buy/sell positions through crossovers. Note: Use another period combination other than the one used in the lecture, explain your choice of the period. (Screenshots required)
The two TRIMA indicators I will love to use here are the 50-period and the 25-period and these are the reasons for me choosing them.
The 50-period moving average is mostly considered as the first line of support in an uptrend or in the case of a downtrend, the first line of resistance.
The 25-period is used here because we aim to use it for a near-term trend change. In the case where we were to employ two TRIMAs for long term, I would have suggested a combination of the 50 and 100-moving averages.
The reason for combining two TRIMA indicators of different periods is that, they help to double-smooth the chart in a way that it does not need to jerk quickly to market price fluctuations. The periods has one shorter and the other longer so that in the case of a crossover, and based on its direction assumed, the trader then decides whether or not it is a buy order.
Buy Crossovers of TRIMA indicators
In this situation, the shorter period TRIMA crosses over the longer one upwards and this indicates an uptrend in progress. At this moment, a buy order can be setup with diligent trade management to ensure continuity of trading.

The chart clearly shows the interesting points that have been previously discussed (entry position, stop loss point, take profit point). The entry was set after the crossover and a confirmation from 02 bullish crossovers.
Sell Crossovers of TRIMA indicators

Conversely, when the short TRIMA indicator crosses over the longer indicator downwards, a bearish market trend is anticipated. This is seen in the chart that once the 25-period (in yellow) moving average crossed over the 50-period (in navy blue) moving average, the trend of the market became bearish as a resultant downtrend was evident.
The trader may decide to wait for a few candlesticks to switch before entering the trade but with proper management, setting a stop loss and take profit, the trader should be in a comfortable region.
QUESTION 6
What are the conditions that must be satisfied to trade reversals using TRIMA combining RSI? Show the chart analysis. What other momentum indicators can be used to confirm TRIMA crossovers? Show examples on the chart. (Screenshots required).
Again, as the singing song of trading, a single indicator is good but it is even much better when a second is added to it. “Two heads are better than one” is not a new proverb thus “Two indicators are better than one” in the crypto-verse. In combining with the RSI to reduce the reaction time for a trade reversal. Two scenarios are enumerated below;
Trading the TRIMA & RSI in a Bullish Reversal
- The two TRIMA and the RSI are inserted into a preferred chart.
- If the market is bearish or in consolidation mode, the RSI is looked to check whether the oversold region has been reached which is vital in the reversal.
- The shorter period TRIMA indicator is then waited for it to cross the longer period upwards and a few candlesticks confirmation set, then a buy order is set.
- Proper management strategies are put in place as the setup is furnished with stop loss and take profits with a risk to reward ratio of at least 1:1.

As seen above, after a period of price uncertainty, the RSI reached the oversold region and signaled a buy order. After a little while, there was a crossover of the TRIMAs as the shorter one was seen to crossover the longer one upwards.
Trading the TRIMA & RSI in a Bearish Reversal
- The two TRIMA and the RSI are inserted into a preferred chart.
- If the market is bullish or in consolidation mode, the RSI is looked to check whether the overbought region has been reached which is important in the reversal.
- The shorter period TRIMA indicator is then checked for it to cross the longer period downwards and a few candlesticks confirmation set, then a set order is set.
- Proper management strategies are put in place as the setup is furnished with stop loss and take profits with a risk to reward ratio of at least 1:1. This again solely user-variant.

After an uptrend, the RSI reached the oversold region and signaling a sell order. After a little while, there was a crossover of the TRIMAs as the shorter one was seen to crossover the longer one downwards.
Another momentum indicator combined with the TRIMA crossovers.
Another example of a momentum indicator that we can use is the Moving Average Convergence Divergence MACD which is pretty popular.
The functionality of the MACD is basically as follow;
- Whenever the MACD line crosses from the signal line upwards, it is considered a bullish move, and the further it is from the zero line, the stronger the signal.
- Whenever the MACD line crosses from the signal line from above to below, it is considered a bearish move, and the further it is from the zero line, the stronger the signal.
A good example is seen below;

QUESTION 7
Place a Demo and Real trade using the TRIMA reversal trading strategy (combine RSI). Ideally, bullish and bearish reversals. Utilize lower time frames with proper risk management. (Screenshots required).
USING MY VERIFIED REAL ACCOUNT
I will love to use the tradingview panel to analyze my LUNAUSDT chart and execute the trade on my verified binance
Short on the LUNAUSDT pair

As seen above, the RSI indicator identifies the current asset price at an overbought region indicating a reversal in the preceding uptrend shown. As a result, I decided to enter a sell order placing my stop loss and take profits in order to properly manage my funds. The results of these two indicators in this trend reversal is shown as follows;


Screenshot from binance
I was able to make a profit of $0.15 as seen above after a combination of these two indicators as greatly explained by the professor.
USING A DEMO ACCOUNT
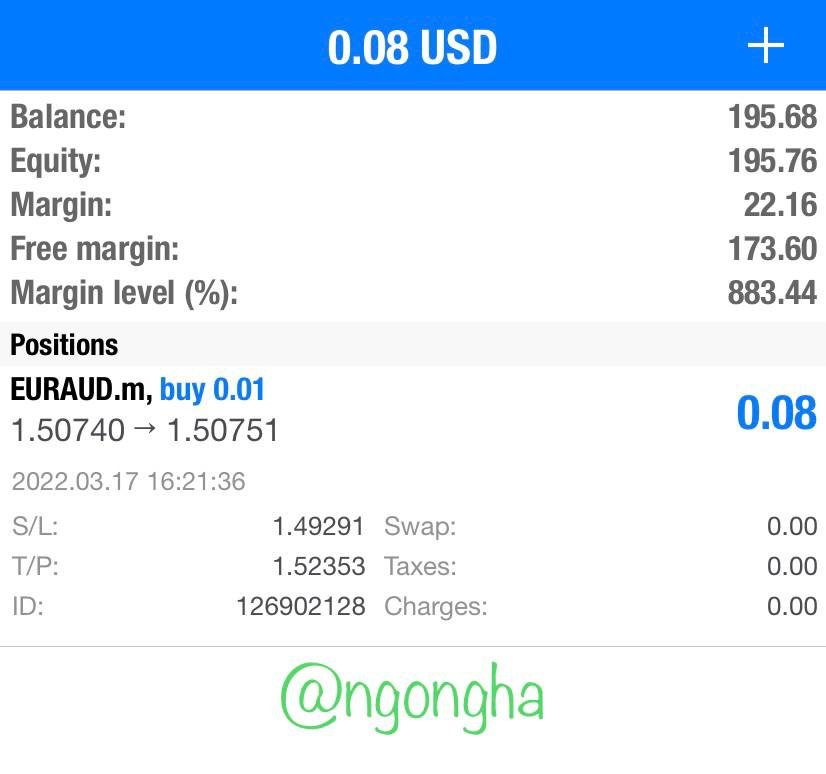
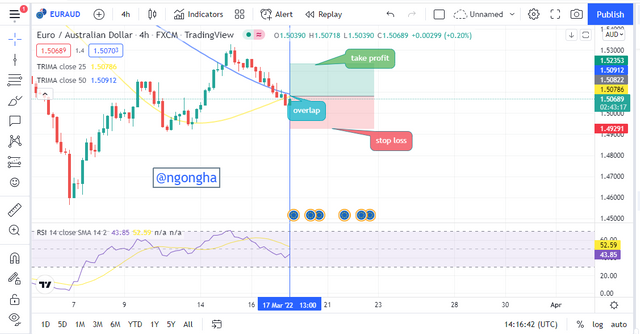
The trade here is using the EURAUD chart. Seen above, the RSI indicator identifies the current asset arriving at the oversold region. Then, I entered a buy order placing my stop loss and take profits in order to properly manage my funds.
This analysis gave me a profit of $0.08 as properly shown above.
QUESTION 8
What are the advantages and disadvantages of TRIMA Indicator?
All indicators are used for a particular use with their individual peculiarities and by choice by the traders. Thus, below are some of the advantages and disadvantages of using the TRIMA indicator.
| ADVANTAGES | DISADVANTAGES |
|---|---|
| When combined, they can produce crossover regions which are either bullish or bearish from which the trader can reap profits | At times it tends to be far away from the current market price whenever there is a strong trend. This makes it less useful in the determination of a close support or resistance level |
| As the price moves to and fro, the TRIMA doesn’t react as much, thus letting the trader know the trend has not yet shifted | it doesn’t react quickly in markets that are highly volatile, implying it takes a longer while for it to change direction. |
| Can set itself as a suitable dynamic support or resistance which is vital for trading as they tell the trader the watch out points | In case where the support and resistance fails, the trader may go in losses. |
CONCLUSION
The TRIMA indicator is the average of an average, as it creates a line on the chart that moves in longer and steadier waves as compared to traditional SMA. They can also be used as dynamic support and resistance zones, and since it reacts in a much slower price change, it can keep a trader in a trend longer thus reaping much profits.
Nothing as a perfect indicator exists, thus this indicator has to be tested with different periods as suitable by traders and done on demo accounts before real accounts as the professor rightfully outline.
THE IMAGES USED HERE ARE ALL SCREENSHOT FROM tradingview.com
I want to heartily thank Professor @fredquantum for this intriguing work.
CC:
@fredquantum