Crypto Academy /S4W8-Homework Post for kouba01
Hello my good friends. How are we all doing today. It feels great to be with you all once more. I am delighted to engage once more in this weeks steemit crypto academy. I will be engaging in the homework task of @Kouba01 who taught on the topic Crypto Trading With Rate Of Change (ROC) Indicator.
In your own words give an explanation of the ROC indicator with an example of how to calculate its value?And comment on the result obtained.
What is a Rate of Change Indicator(ROC)?
This is a momentum-based indicator that ascertains the %change in price between the price of a past N-period of time and the current price.
This indicator is usually interpreted by its position with respect to the zero line. If the indicator moves upwards crossing the 0 line territory into the positive area, this implies that the price is moving upwards.
But if the indicator is pointing below zero line level into the negative zone, this implies that the price is moving downwards.
The ROC can be used to identify divergences in an asset market,. It can also be used to identify overbought , oversold positions, crossovers and continuation of trend patterns.
So the ROC is used to easily
● discover a new trend even when it is still ranging
● Determine the continuation of the trend, whether it still has more strength to move on in the current trend
● whether a reversal is imminent.
How to calculate the ROC value
To calculate the ROC, we use the formula
ROC = ((Cprice - PN periods back) / PN periods back) * 100.
Where
Cprice = current price of the asset
PN periods back = price for the past 25 period.
In using the above formula, one of the major indices used in calculating is the N-period. We need to know that for a short-term trader, a small N-value such as 9, 12 will be most appropriate, because the number of days being compared to will be closer. For a medium-term trader, using 25 day period price value is best and for a long-term trader, they can use 200 day period price as the N-value.
The N-value shows us how many periods past to which the current price is compared to. So using a smaller n-value will cause the ROC to react quickly to price, bringing about so many false signals, while a longer n-period value will cause the ROC to react slower to price but the signal can be relied on more.
Lets illustrate how to calculate the ROC value
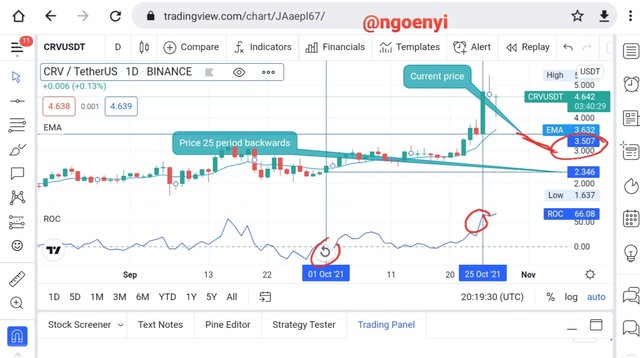
Using the chart of crv/usdt
I want to calculate the 25-period ROC for an asset whose value is $3.507 and 25 periods ago, it's value was $2.346
ROC = ((3.507 - 2.346)/2.346)100*
ROC = (1.161/2.346)100*
ROC = 49.49%
Observation
We can observe from the above example and calculation, the ROC indicator value was 49.49%. This implies that there have been a bullish movement of about 49.49% in the price of the asset over the past 25 period. This caused a move from $2.346 to $3.507.
Note that the higher the chart time frame you use, the higher the value of ROC that will be generated, either to the positive or negative side.
This is a massive price upward movement.
Demonstrate how to add the indicator to the chart on a platform other than the tradingview and highlighting how to modify the settings of the period(best setting).(screenshot required)
To add the ROC indicator to my chart, we need to follow the steps below.
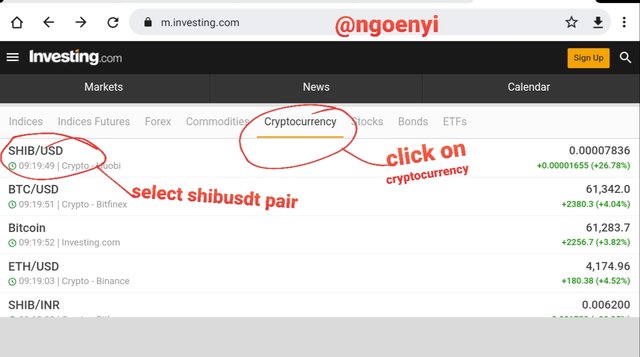
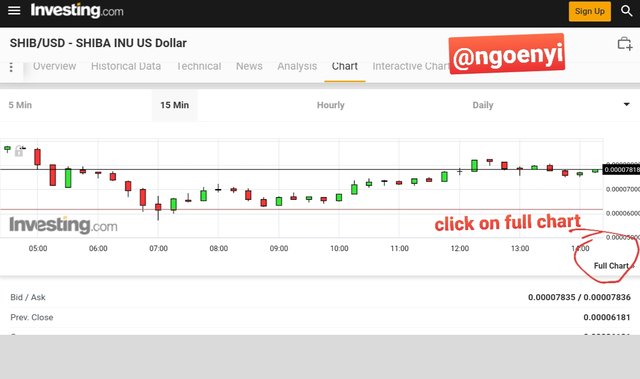
● I will open a chart of an asset pair on investing.com. I am using the chart for the pair of shib/USDT.
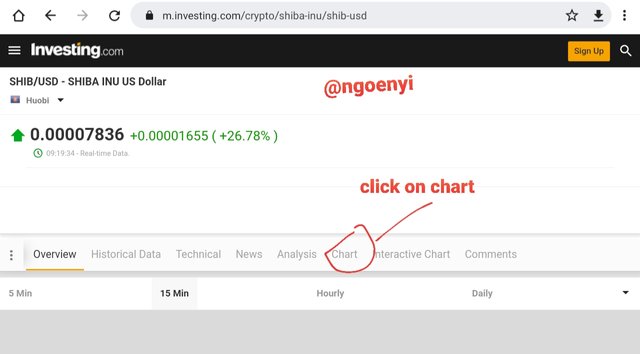
● click on cryptocurrency, select the asset pair and click on chart.
● when the chart appears, look down and select full chart. Change the chart to candle stick charts
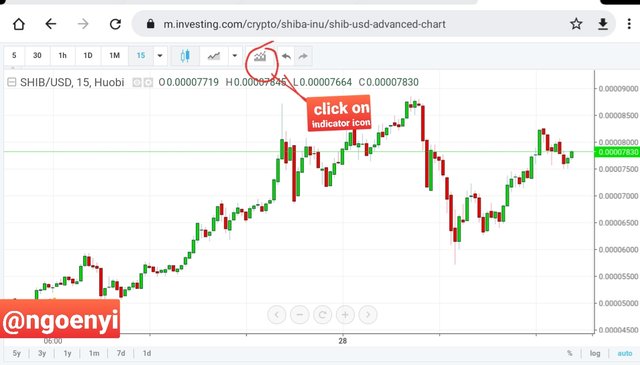
● Click on the indicator icon.
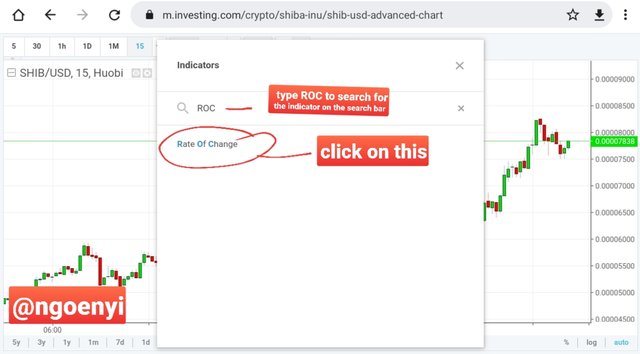
● on the indicator search bar, type ROC and select the ROC indicator
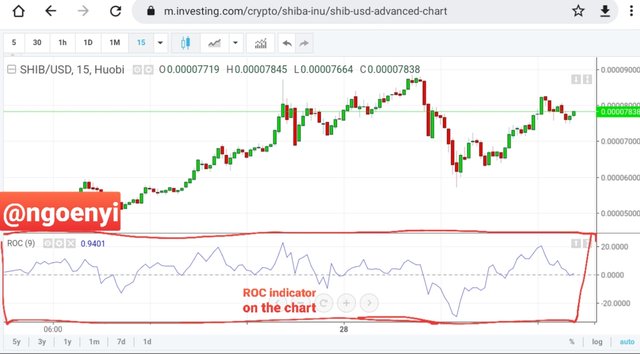
● It will then appear on the chart.
 |  |
|---|---|
 |  |
| ---------- | ---------- |
 |  |
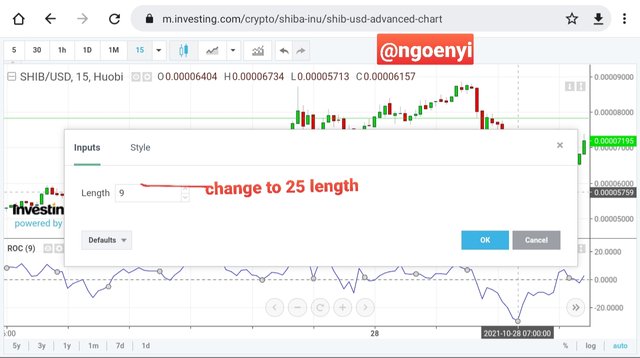
To adjust the settings
● Click on the ROC settings icon
● A dialogue box appears, I now changed the length to 25 from 9 which is the length by default.
● I also changed the ROC line colour setting to red and the zero line setting to blue. This is optional or it may be the colour that suits you.
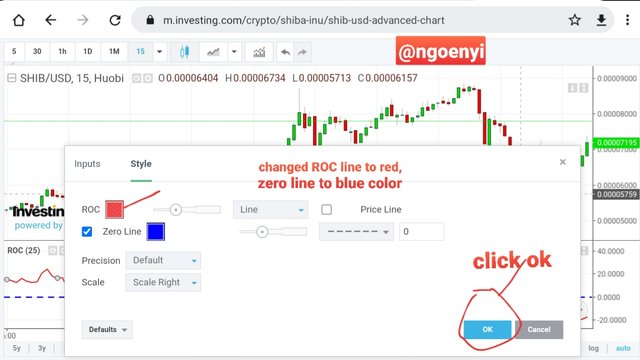
● You can now see adjustment made at the settings as it reflected on the chart.
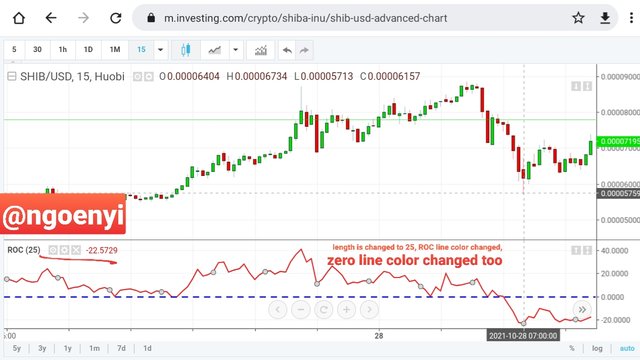
You will observe that when the period was at its default setting, the ROC was closer to the zero level, signifying its quick reaction to price, however, with the adjustment to 25, it was now reacting slower to price movements.
There is no best setting on the length. The best is determined by the trader and his style of trading. If he is a short-term trader, it is best to use 9 and 12 length. If it is a medium-term trader, 25 length stands a better figure and for a long- term trader longer periods like 200 should be used.
What is the ROC trend confirmation strategy? what are the signals that detect a trend reversal? (Screenshot required)
ROC trend confirmations
I have earlier mentioned that the ROC indicator measures the percentage change in price of a stock within a particular period of time. This is determined by the movement of the ROC indicator line along the zero line. When the indicator line crosses above the zero line, it is a confirmation of an increase in price and therefore a bullish movement.
On the otherhand, when the indicator moves below the zero line, it shows a downward movement in price and therefore a bearish movement.
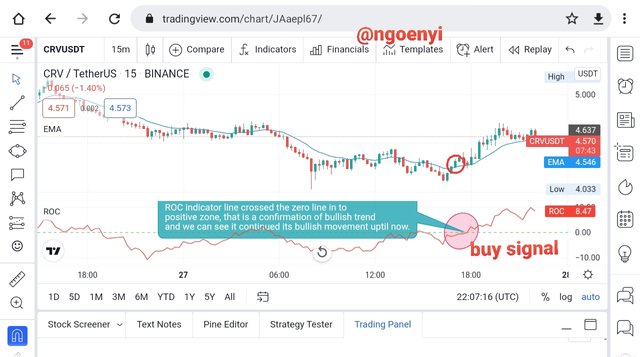
Let us illustrates that with a chart.
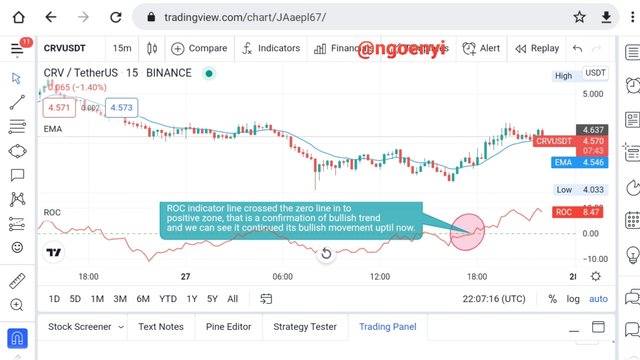
From chart above, we observed that the ROC indicator line crossed the zero line into a positive zone, above the zero line. That is a confirmation of bullish trend and we can see it continued its bullish movement uptil now. So in an upward price movement, the ROC is usually above the middle point of zero, and continues to increase further up.
The same strategy goes in confirming a bearish trend. When the ROC Indicator line crosses below the zero line and stay below it with the price moving downwards, it is a confirmation of a bearish trend
The chart below shows thus
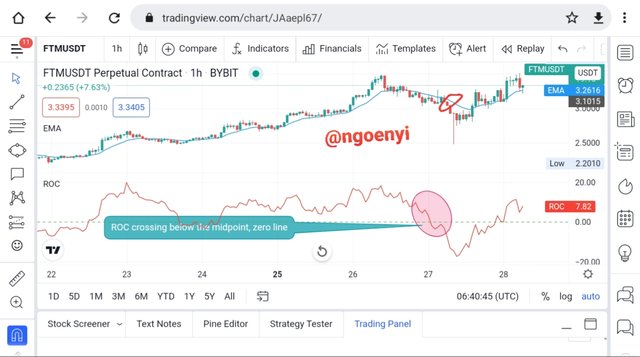
From the chart above, we can see the indicator crossed below the zero line and sustained such price downward movement even after a retest of the zero midline.
This confirms the bearish trend of the asset pair under consideration.
Signals that detect trend reversal
One of the signals that helps to detect a trend reversal is when the asset price is in an overbought or oversold positions.
When it is in overbought positions, it would not be too wise to enter a long position because definitely there will be a correction in price before the continuation of the uptrend. This is also applicable to an oversold market. At that point there may be a permanent or temporary trend reversal.
Secondly, another signal that can foretell a trend reversal signal is when there are divergences between the movement of the price and the ROC indicator line movement.
When the asset price is moving upwards and the indicator line is moving downward, this shows a weakness in the strength of the upward trend, showing that a reversal is imminent. Such divergences can also be seen during a downward movement.
In both cases, it is a signal of trend reversals. However, it is usually advised not to take position when such signals take place until the price movement confirms it by moving in the direction of the indicator. Such confirmation will be accompanied by a trend breakout.
What is the indicator’s role in determining buy and sell decicions and identifying signals of overbought and oversold؟(screenshot required)
The ROC indicator can be very useful in determining the buy or sell signal of an asset pair.
For a buy signal, the indicator line should move above the midpoint zero level and sustains its position above the zero level. At that point, it would be wise to enter a buy position.
Let look at the chart below.
You can see from the chart above, that the indicator line was well above the zero line level and in the chart it is accompanied by a price movement that crossed the neckline upwards. Thus confirming the bullish movement.
For a sell signal, the ROC indicator line should cross below the midpoint zero line and sustains it position below the zero level. At that point, a sell signal is generated.
The chart below show thus
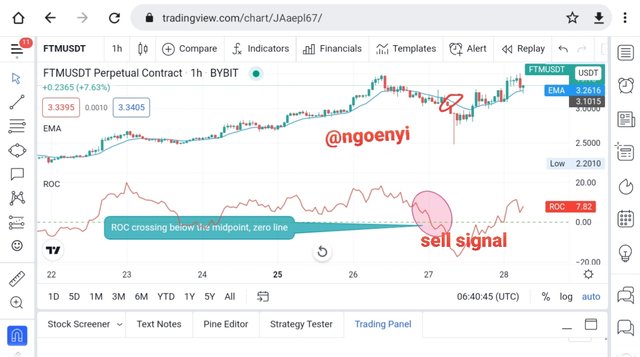
From the chart above, we observe that the indicator line was below the zero level and we can see the corresponding level in the chart. There was a breakout below the 200 EMA line showing at least if not a permanent reversal but a temporary one.
Signals of Overbought and Oversold Limit Using ROC Indicators
The overbought and oversold limits of the ROC indicator works best when there is no observed trend in the market. This makes it very easy to locate the supports and resistance of the market.
During this situation traders choose some extremes of the ROC indicator and mark them as areas of overbought and oversold positions. The range is between -/+3 or -/+4 as the case may be.
So when the indicator is at +3 or +4, instead of taking a buy position, it would be best to enter a sell trade and move along with the price correction down since the upward movement might have been exhausted.
Similarly, when the indicator is at -3 or -4, it is an indication of being in an oversold position, so it would be more preferable to enter a buy trade.
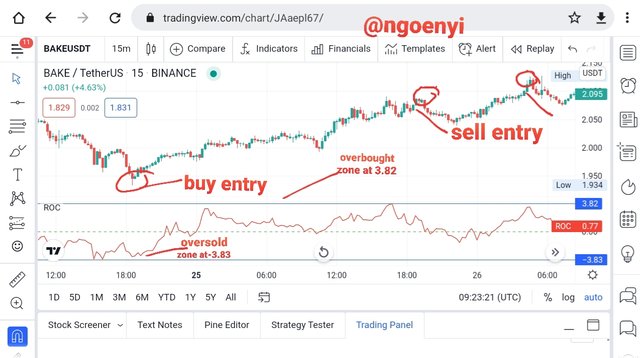
This strategy can be more beneficial to intraday or swing traders.
From the chart above, we can see that an entry at both extreme points ( at 3.82 - a sell position and at -3.83 a buy position) can be profitable to the trader in the short-term.
Take note that this is applied when there is no trend direction in the market. The market is ranging.
How to trade with divergences between the ROC and the price line? Does this trading strategy produce false signals?(screenshot required)
Divergence is simply the disparity in movement between the price of an asset and Rate of Change indicator.
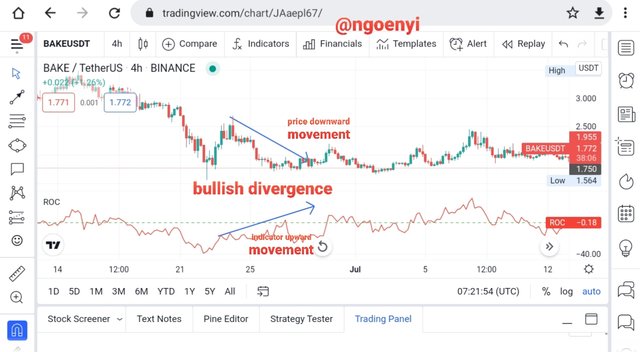
Bullish Divergence
This occurs when the price of an asset is moving downwards meanwhile the ROC indicator line is moving upwards. Hence as the price forms new lower highs and lower lows, the indicator forms higher highs and higher lows. This is a sign that the strength of the downward movement is weakening and is about to reverse.
This is illustrated in the chart below.
It is always best to wait for price reversal confirmation before taking a trade.
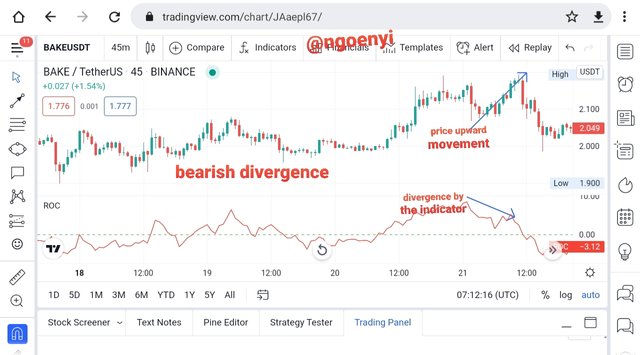
Bearish Divergence
This occurs when the price of the asset pair is moving upwards and the ROC indicator line is moving downwards, in the opposite direction. As the price forms new higher highs and higher lows, the indicator forms lower highs and lower lows. This implies that the bullish trend is weakening and thus a reversal is imminent.
Like I earlier mentioned, it is best to wait until the price reverses before taking a trade.
Can this strategy produce false signals
This strategy can also produce false signals. There is no indicator that gives a 100% accurate signal. So sometimes it can produce false signals.
However, to be on the safe side, it is best to use it along with other technical indicators like the EMA and the RSI. This will help verify the accuracy of signals and filter out false ones.
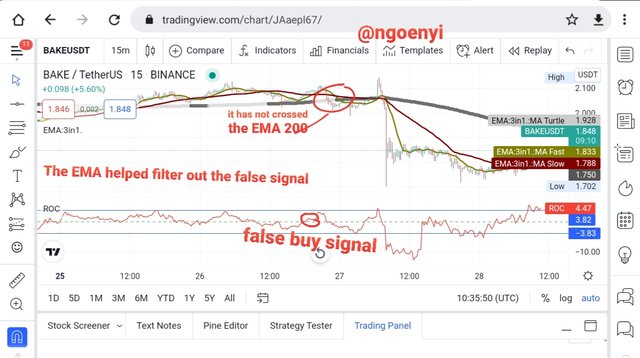
You can see from the chart, the EMA helped to filter out the false signal from the ROC indicator.
How to Identify and Confirm Breakouts using ROC indicator?(screenshot required)
Breakouts occur when a key support or resistance is broken by price movement. It is caused by a strong momentum in price. Ordinarily, before it does that, it has tested the support or resistance several times before it can breach it. So during that period the market is in a consolidation or lateral movement.
From the ROC point of view, before a breakout occurs, the indicator normally moves slightly above or below the zero line level
So once a breakout occurs, it will be very obvious on the indicator as there would be a sharp movement up or down depending on the direction of the breakout. This implies that price have broken out of the resistance or support.
Let us see the chart below.
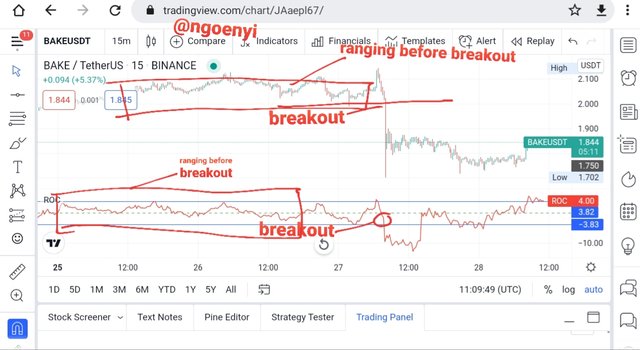
From the chart above, we can see that the market was ranging, price was within a particular range before the breakout occured. This was followed by a serious downward movement of price. The indicator also showed the sudden breakout and had a reading well below the range area to -10% ROC.
Review the chart of any crypto pair and present the various signals giving by ROC trading strategy. (Screenshot required)
Buy Signal
From the foregoing, we mentioned that the ROC indicates a buy signal when the indicator line is above the zero level. when there is bullish divergence, when the asset pair is in oversold status and when there is a breakout on the upside(a resistance have been broken)
To trade a buy signal using ROC, I will add an EMA indicator to confirm the signal.
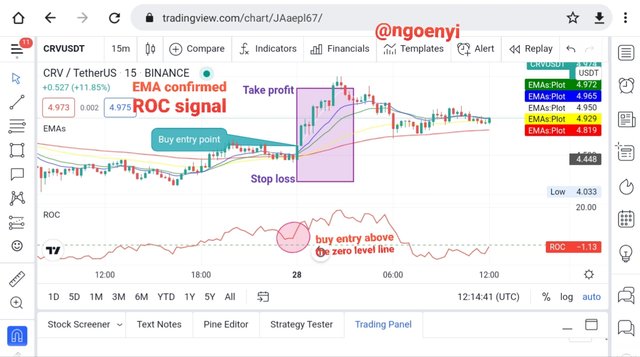
From the chart above, I used the EMA 200 line to confirm the ROC indicator buy signal, Which we clearly saw from the chart.
The buy entry point was placed after the bear candle engulfment by the bull candle. This was also above the zero line and the EMA 200, since it could not break below the support zone.
The stoploss was placed at the next support level. The takeprofit was set at a risk reward ratio of at least 1:1.
Sell Signal
A ROC indicator shows a sell signal when the line is below the zero level and sustains that. The sell signal can also be generated when there is a bearish divergence during an uptrend, when the asset pair is in an overbought condition and when there is a breakout on the downside(when support is broken).
The length of the ROC indicator was set at 25 periods. I also added a 3 line EMA indicator to help filter out the false signals.
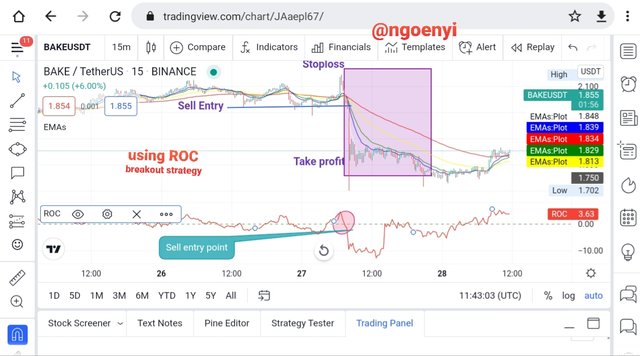
From the chart above, I used the breakout strategy to generate the sell signal, having seen that the market have been ranging and have never broken the EMA resistance.
The sell entry point was right below the zero level and the ranging level.
The stoploss was placed right above the false breakout and the risk reward ration was set at 1:2 in this instance.
Conclusion
I have learned about another wonderful indicator which will be added as part of my trading strategies. The Rate of Change Indicator measures the %change in price between the currwnt price and the price of n-period of time.
It can be able to provide both buy and signal, trend reversal and divergences. However, to get the best out of it, we need to add other indicators to it and also employ our knowledge of technical analysis.
Thank you @kouba01 for such wonderful lecture.
Hi @ngoenyi
Thanks for participating in the Steemit Crypto Academy
Feedback
Total| 9/10
This is good work. Thanks for demonstrating such a clear and well detailed understanding of trading using Rate of Change indicator.
Thank you professor
#club5050 😀
Yes boss, #club5050 all the way