Crypto Academy /S5W1-Homework Post for kouba01
Hello friends, how are we doing. Great to welcome you back to season 5 of steemit crypto academy after the break. I will be writing on the homework task of @kouba01 who taught us on the topic Crypto Trading With Average True Range (ATR) Indicator.

Discuss your understanding of the ATR indicator, how is it calculated? Give a clear example of calculation
What is the ATR indicator
The ATR indicator was developed by Welles Wilder. It is an oscillator different from other oscillators. How? Many oscillators measure the price direction of an asset in the market. But the Average True Range, measures price volatility. So it is used to measure the volatility history of price trend rather than giving a trader the direction of an assets price in the future.
The ATR gives insight concerning an asset pair as to its high volatility levels. Usually when there is high volatility, it will have a higher ATR reading and when there is low volatility there is low ATR reading.
This indicator helps traders to identify take profits and set stoploss level instead of a Buy and Sell setup. When we observe a spike on the ATR indicator, it would be wise to set a wider stoploss and eventually adjust our profit level as well. A trader can use this indicator to manage their trading positions and make more profits in the process.
So we can conclusively say that the ATR helps us understand price volatility and its effects on asset pair chart movement.
How is it calculated.
To calculate the ATR, we need to ensure we have selected the period which we want to calculate, it may be 7 day period, it may also be 14-day period or any other length which suits us best.
The formular for calculating the ATR is as shown below.
Present ATR = (Previous ATR * 13 + Present True Range) / 14
This 13 and 14 is used when we are calculating for 14 days, so it can be changed.
However, we will need to determine the true range first using the formular below.
True Range = max ( High – Low of the day, High – previous days close, previous days close – Low of the day )
Then we will First is to determine the difference between the high and the low
Secondly, we will have to subtract the high from the previous close.
Thirdly, we will subtract the previous days close from the days low.
Whichever of the value that is highest amongst the three calculations we have made becomes our TR.
Let is now assume that our
High = 35.68
Low = 33.89
Close = 34.67
Calculating the TR
True Range = max ( High – Low of the day, High – previous days close, previous days close – Low of the day )
TR = max(35.68-33.89, 35.67-34.67, 34.67- 33.89)
** TR = max (1.99, 1.01, 0.98)**
Our True Range is the greatest of the values, which is 1.99.
To now calculate the ATR
Present ATR = (Previous ATR * 13 + Present True Range) / 14
Let us now assume that our previous ATR is 1.78 and the period we are considering is 14 days, so we will have
Present ATR = (1.78×13 + 1.99)/14
** ATR = (23.14 + 1.99)/14**
** ATR = ( 25.13)/14**
Present ATR = 1.795 which is 1.8 approximately
What do you think is the best setting of the ATR indicator period?
Just like with any other indicator, the periods chosen is entirely dependent on the trader and his trading style. However, it will be wise to note that each time setting affects the sensitivity of an indicator to price volatility. In most trading platforms, the indicator is set at a default of 14 period.
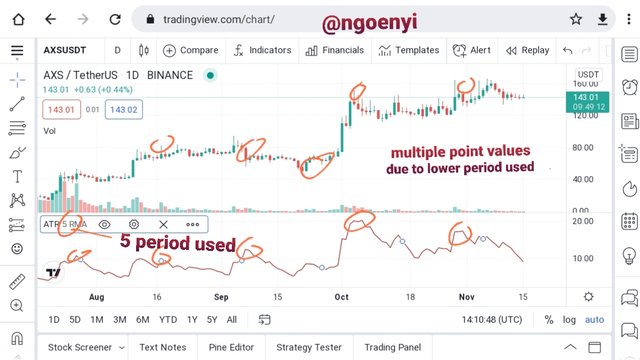
When we use a lower setting, the indicator will be most sensitive to price, giving a faster reading and flashing so many multiple point ATR values.
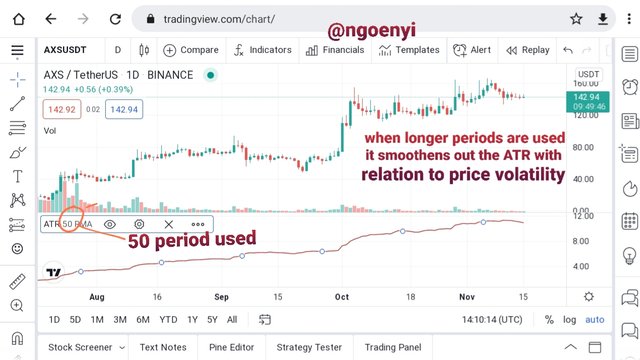
On the otherhand, when a longer period is used, such sensitivity to price is reduced and the indicator tends to give a more reliable ATR over a period of time.
So when a particular setting gives a more profitable result to a trader, he will have to stick to that one. However, this will be confirmed overtime by several trials to determine what best suits him.
How to read the ATR indicator? Is it better to use it alone or with other tools? If so, show the importance. (Screenshot required)
To Read an ATR indicator
It is very easy to read the ATR indicator. Like I have earlier mentioned, when there is high volatility in price, the ATR value is high and when there is low volatility in price, the ATR value is low.
So what this means is that at a price spike upwards, the ATR value is high and when the spike is downwards with less volatility, the ATR value is low.
We will also need to know that the ATR indicator values moves like in a circular formation. It usually have a minimum value. So when it moves up due to price volatility, it will come back to its minimus or base and cotinously repeats that cycle.
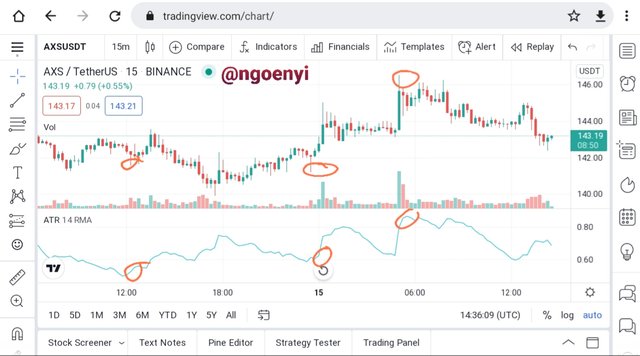
From the chart above, we can observe that where the candle is high which might even be a spike upwards, the ATR indicator value is high, but when the candle stick formed is low even with a spike downwards, the ATR value is also low.
:Should ATR be used alone or with other Tools
The ATR indicator provides the best result for a trader when used together with other indicators. Using it simultaneously with other indicators like the parabolic sar, CCI, etc will help the trader know the precise price level that will be attained by the asset pair.
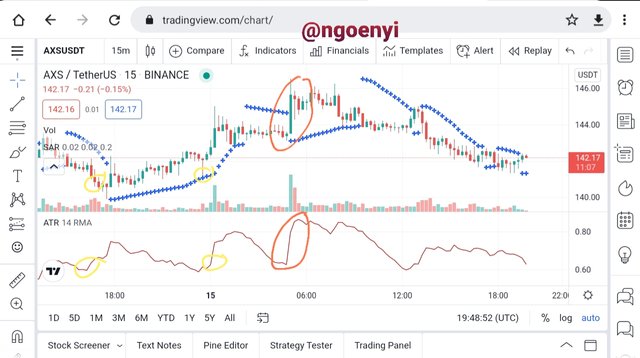
From the chart above, we will observe the yellow circle, which is the area where we had a bearish move. We will notice the volatility of the price downwards does not have such high momentum. This is characterized by the the low ATR value had at that point.
On the otherhand, we can see the high price volatility of the bullish candle and its accompanying ATR value which was also high. This is also confirmed by the Parabolic Sar.
So using the ATR indicator with other tools can definitely enhance its functionality.
How can one know the price volatility and how one can determine the dominant price force using the ATR indicator? (Screenshot required)
How to know Price Volatility
Using the ATR indicator can help us to know the price volatility. Like I have earlier mentioned, price momentum or volatility is identified with an increase in value of the ATR reading. Thus such volatility is accompanied with increase in the ATR value whether on the upward or downward movement. It is also good to note that the ATR tends to change once it reaches its minimum value
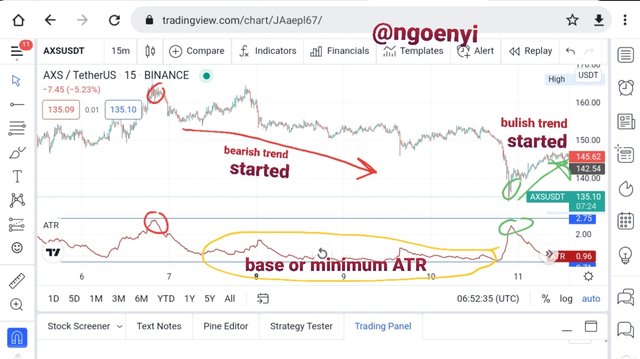
Using the asset pair of AXSUSDT, it is quite clear that price volatility occurred, which led to the ATR also experiencing such spike in its value. The points with red circles is the place at which the volatility happened. That signaled the beginning of a bearish trend.
After that volatility, the ATR went back to its base or minimum.
At another point with green circle, we also experienced price volatility and we can observe the sudden spike in the value of the ATR indicator. This time around, it signaled a bullish reversal. After that point, the ATR went back to its minimum.
Thus we can conclude ATR indicator values spike is directly proportional to price volatility, which often times may be a sign of trend reversals.
Determining dominant price force using the ATR indicator
We must bear in mind that a price increase does not usually necessitate increase in ATR values rather its volatility. So When ATR value increases it helps us know the dominant force of price obtainable in the market, whether it is bearish or bullish.
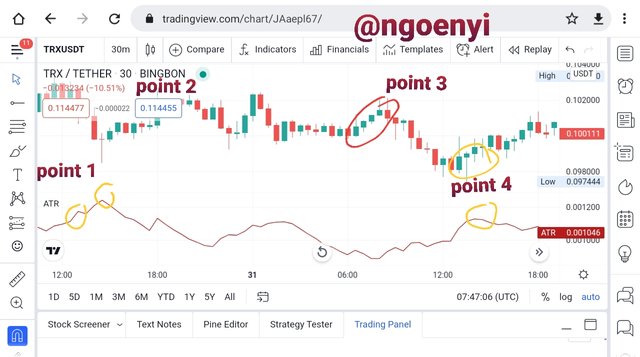
From the above sample chart, we will observe that at point A, the price drop corresponds with an increase in ATR value, indicating price volatility. This simply implies that the dominant price at that point is bearish.
At both point 2 and 3, the increase in price as can be seen with successive bullish candles was not supported by the ATR indicator. Thus proving that it is not the dominant force in price yet.
But in point 4, we observed that the increase in price led to an increase in the ATR indicator value, thus indicating price volatility. At this point, the trend have reversed from bearish to bullish. So the dominant force on the price now is bullish.
So by checking the price action chart and comparing it with the indicator, we can clearly extricate the dominant force on price of an asset pair, which will help us ride the trend comfortably.
How to use the ATR indicator to manage trading risk ?(screenshot required)
Risk management is an important factor in every traders life.
There are basically two ways we can manage trading risk using ATR. These are by
● Using ATR to place our stoploss
● Using ATR to place our takeprofit.
Stoploss
For every trader, placing stoploss is very essential. It is an important part of trading on trader should ignore. It helps us to li it the level of loss we might incur if the trade goes against because of uncertainties that are not predictable in the market.
Additionally, we all know that the market is a 24hr market, thus, we may not be awake at all times to check our trades. This makes it imperative that we place stoploss any time we open a trade. In fact, it should be determined before placing the trade.
Using ATR as an indicator can helps us to set our stoploss.
To do that, we will find out our present ATR, then we will determine the level of stoploss we want to place, whether it is 2×ATR, 1×ATR or 3×ATR.
We will then subtract the particular stoploss level from the entry price. This will give us our stoploss price.
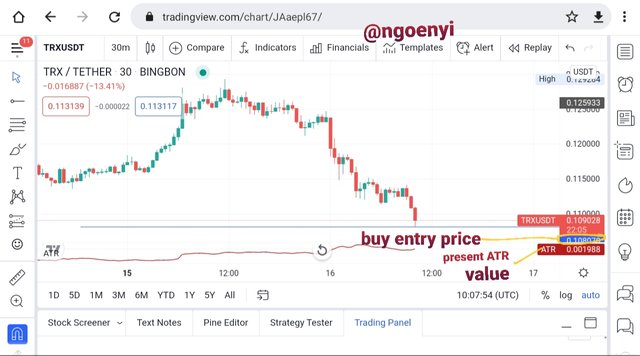
For example, using the chart above, we want to open a buy entry at 0.0108920 and the ATR value is 0.001988
then to calculate our stoploss, I am using 3×ATR = 2× 0.001988 = 0.005964
Stoploss price = Entry price - stoploss level (3×ATR)(0.005964)
Stoploss price = 0.0108920 - 0.005964
Stoploss price = 0.004928
TakeProfit
Setting our takeprofit level is another way of managing our trading risk. Just like explained in the case of stoploss, if we do not set our takeprofit level. Our trade may bet to the desired range and now retrace for correction which can make us lose money too. We may not also be awake every time to monitor till it gets to our desired profit price. So the wisest th8ng to do is to set the take profit level.
We can also use the ATR to set our take profit level.
We calculate our take profit by adding our entry price to how many times of the ATR we desire.
Using the chart above
Entry price = 0.0108920
3×ATR = 0.005964
Take Profit price = 0.0108920 + 0.005964
Take profit price level = 0.015892
NB The two scenarios calculated above is for a buy entry position.
How does this indicator allow us to highlight the strength of a trend and identify any signs of change in the trend itself? (Screenshot required)
I have earlier mentioned that the ATR measures the level of price volatility and not price direction. When there is strong price volatility in either side of the market, it is followed by high ATR range values, while less volatile price movements is followed by lower ATR values.
Using the ATR indicator, we can ascertain the price range of an asset
ATR indicators can be used to validate the strength of a trend. When there occurs price volatility on the upward side which is usually accompanied by high value ATR, and this rupture is sustained by subsequent price movement sustaining the buying pressure. We can say that the trends strength is still very strong having known the range the price can get to.
This is especially true when a strong resistance is broken for upward movement of price.
Likewise, when price volatility occurs on the downward side with high value ATR, and this movement is sustained by subsequent downward selling pressure and price volatility on the down side, It implies that the trend down is still strong and the trader is well aware of the range the price can get to as well.
However, this is most appreciated when a strong support is broken by price movement.
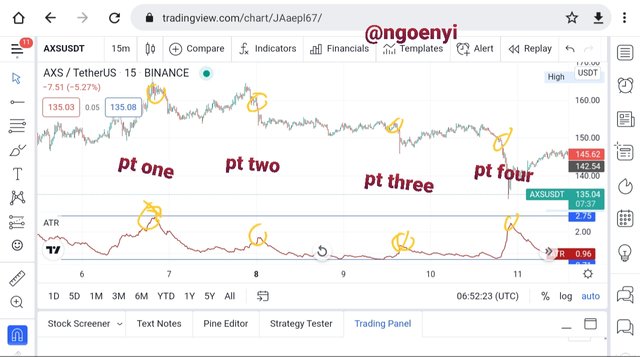
From the above chart, at pt one, was when the first volatility occurred giving a very high ATR value, subsequent minimal price volatilities in pt two and three, where all sustaining the selling pressure. Now at pt four, we saw another price volatility with very high ATR value, reinforcing the selling pressure , strengthening the downward trend.
Using ATR indicator to identify signals of trend change
The ATR indicator can also be used to identify signals of trend reversals. I will be using the chart below to illustrate that.
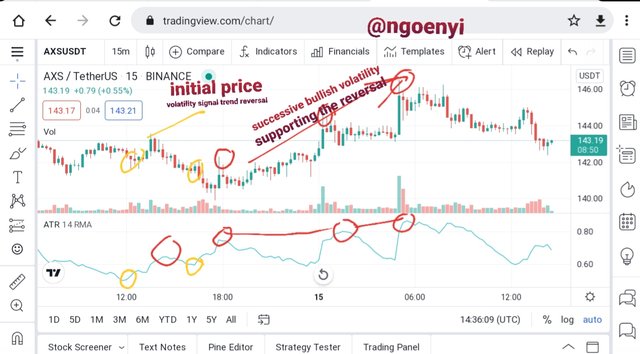
From the chart, we can confirm that the trend was already bearish but was losing strength. This is seen from the last bearish spike in yellow circle which had very little impact on the ATR value, since it even deepened the more. Rather the the ATR value increased with the bullish candle stick To further confirm this suspicion, the next price price volatility was seen on another successive bullish candle spike; a breakout, reinforcing the bullish trend reversal.
From them on, we noticed constant price volatility with higher ATR value on the upward price level of the chart(the area circled with red color)
Another way we can use this indicator to identify trend change is when noticet after the ATR indicator registered a high value continues to be at its minimum over a period of time without exceeding that previous ATR indicator high value. It may also serve as a signal for trend reversal.
What are the advantages and the disadvantages of this indicator
Advantages of ATR indicator
It helps the trader to measure price volatility of the asset pair, since higher values implies that the asset is volatile with larger price moves.
It helps the trader to be able to set appropriate stoploss and take profits having known the ATR range for the period.
It also provides the trader with a very good entry points, if it is used simultaneously with other indicators.
It is very easy to read is presented in very simple way on the chart.
It can be applied on any timeframe and setting adjusted depending trading style of the person
*Disadvantages
It does not provide the trader with buy or sell signal, making the traders work more cumbersome
The trader must work with other indicators so as the get the best out of this ATR indicator.
It does not provide any information to the trader concerning future price action of an asset pair
Conclusion
It was really a great opportunity to learn about this indicator from you. I have understood it more better than before. I have also seen multiple ways in which I can put it into great use.
Great thanks to @kouba01 and the steemit community for making this opportunity possible.
Hello @ngoenyi,
Thank you for participating in the 1st Week Crypto Course in its 5th season and for your efforts to complete the suggested tasks, you deserve a Total|9/10 rating, according to the following scale:
My review :
Work with excellent content, because you have taken every question seriously, allowing you to get answers that are precise and in-depth in its analysis and clear in its methodology. And here some notes :
A good interpretation of the ATR indicator, it was possible to rely on a graph to confirm the results obtained in calculating the value of the indicator at the moment T.
It would have been possible to go in more depth to explain the difference between an increase or decrease in the value of a period and to have clearly stated your personal choice.
Your answer to the third question was clear and successful.
You did well to answer the rest of questions, both in theory and in practice.
Thanks again for your effort, and we look forward to reading your next work.
Sincerely,@kouba01
I appreciate. Thank you dear professor