Psychology of Trends Cycle –Crypto Academy / S6W4- Homework Post for @reminiscence01".
Now we are in season 6 week 4. Hope all are well. No further due let's get started.


Today I am going to discuss Dow Jones Theory. The theory was developed by Charles H. Dow in 1997. The theory still works in the finance market. According to Dow Jones theory, in the finance market, we can see three conditions first one is the uptrend second one is the downtrend and the third one is sideways. Simply, he believes that the market is the result of demand and supply which is discounted price.
I have said earlier that it plays a big role in determining our trends. It is never possible to make a profit in the market without determining the trend because if you trade against the trend, you are most likely to lose. We usually do technical analysis and chart analysis to find trends and find good positions. And this theory gives us a basic idea about the market, so I think it's a very important theory and a theory that works in the present.
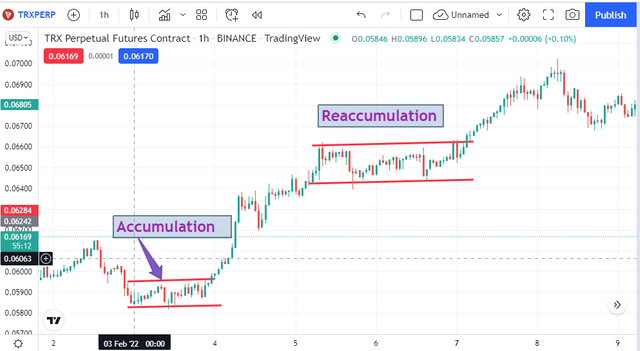
Accumulation
We see the presence of different types of traders in the market. Different traders have different capitals and they trade in different psychology. But sometimes we see the big ups and downs happen in the market. This usually happens when there is a big player in the market.
If any trader understands the presence of big players then he can book profit from there. Whale and an institution are known as big players in the market. They take the market to a downtrend to book profit from the market and once their profit is booked they close the market position again. When their presence in the market decreases, a situation arises in the market and this is called accumulation. They change their position and start profiting from the market again and take it a long way by turning it into a trend. Let's see a screenshot for a clear idea.
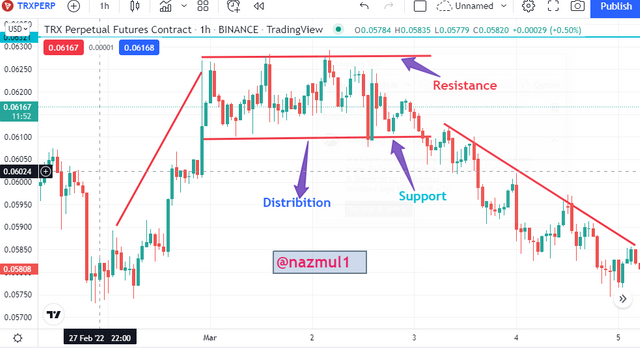
Distribution
I have already discussed the accumulation phase and the opposite of the distribution phase. We will get the distribution phase in the market only when the presence of the buyer in the market decreases. When the buyer's presence begins to decline, the volume will usually be lower and the volatility will be lower. Then the situation that we will see in the market is a downtrend and from here small traders take the opportunity. Let's take a look at a screenshot I shared below for a better understanding.
If we primarily want to analyze what a market is, then we can see three conditions in the market, there can be no other condition. They are bullish, bearish, sideways. Let's see a brief discussion about them.
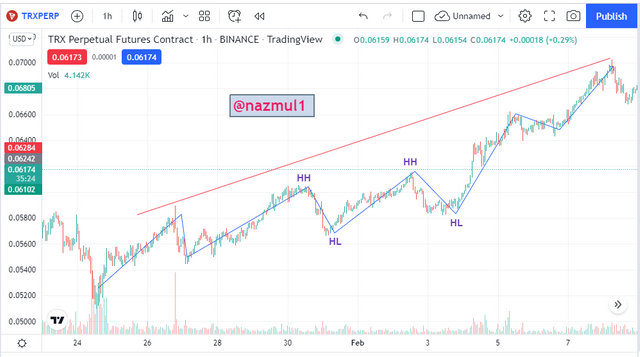
Uptrend Phase
When a buyer buys an asset he expects the most uptrend or bullish phase. That is, when the market structure produces a higher high and higher low, the price of a product increases in the market, it is called the bullish phase. This means that the price of assets will continue to increase in the market at a certain time compared to the past, a situation that we call the bullish phase. The psychology behind creating such a situation in the market is that the buyers are more active here and it helps to increase the price and because the sellers are less active here, the price of the product increases for a certain period of time.
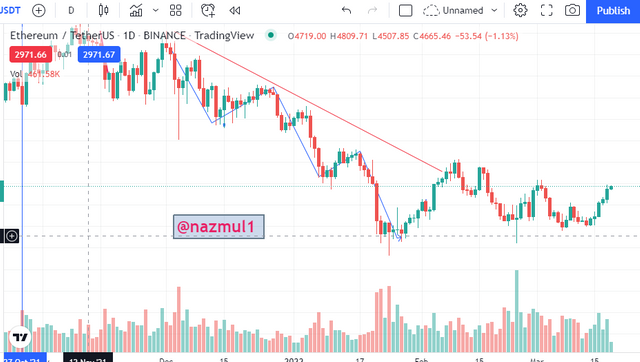
Downtrend Phase.
We will see the downtrend of the opposite condition of the uptrend. Firstly, we will see in the market structure Lower High and Lower Low condition. The psychology behind such incidents is that the presence of sellers is high and buyers are less powerful here so sellers have a direct role in reducing the price of any product in the market. In other words, we can say that where supply exceeds demand then price decreases, and this decrease is called a downtrend. Usually, those who hold the product buy the asset in such a situation. And when the price goes up, it sells.
Sideways
Here the presence of buyers and sellers in the market is almost equal and demand and supply are almost equal. This is usually the case when there is an uptrend or downtrend and when the buyers and sellers are equal in the market. Here we get less comparative volume because at the same time the presence of both traders decreases. The market fluctuates between certain support and resistance. Then the bullish or bearish movement of the market is seen.
Volume is an indicator that we usually use most often to confirm a trend. We can easily detect false breakout using a volume indicator if there is a false breakout there is less volume. Suddenly this volume indicator plays a direct role in increasing the success rate of our trading.
When we see the uptrend in the market there will be a little more volume and with this volume, we can confirm the uptrend. Here the buyer has more volume for high pressure.
When the sideway is made in the market, there will be less volume. Here the volatility is relatively low and the sideway can be easily determined by looking at the volume.
When the existence of sellers in the market increases then the market goes into a downtrend. There will be more selling pressure and an increase in volume as well.
The Crypto market is a very volatile market and it is not easy to make a profit here. Good strategy and skill can make a profit here. I think I can make as much profit as I can be skilled here. So let's see how we can trade in three phases and see which of the criteria to follow.
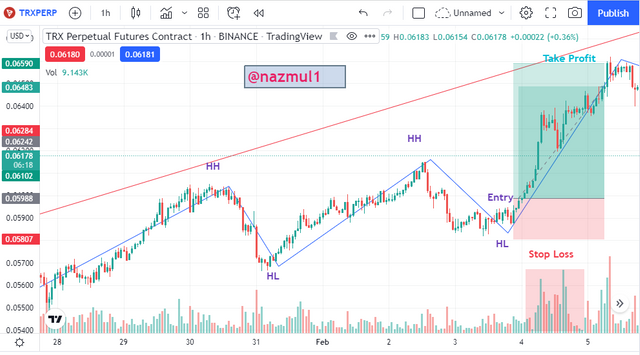
Trade Criteria for uptrend
- First we need to identify the uptrend from the chart. I have already said that we will understand the update only when Higher High and Higher Low are created on chart.
- We can take the help of other indicators to confirm the uptrend. Using such volume indicators we can confirm the uptrend.
- Then we'll wait for the retracement. We will look at the volume again later with the volume indicator and if the volume is high then we will trade there.
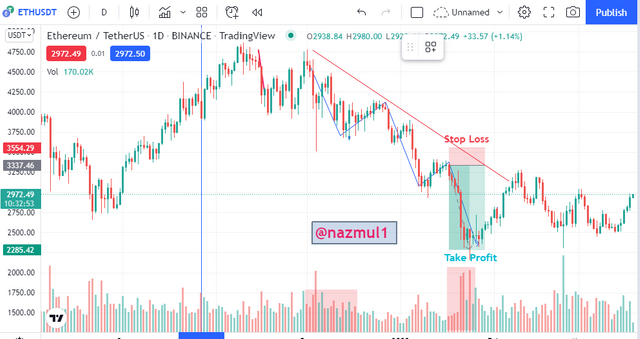
Trade criteria for Downtrend
- First, we need to identify whether the market is on a downtrend. If we take a closer look at the chart, we can see that Lower High and Lower Low are forming.
- In order for the downtrend to be confirmed as we have previously confirmed the uptrend, we must look at the volume.
- Here we have to see the retracement then open the trade.
- Proper risk-reward ratio can be included to open the trade.
Trade Criteria for sideway
- When buying and selling pressure is almost equal then we see sideways in the market. We have to understand.
- The fluctuation will be between support and resistance.
- The volume will be less which is noticeable.
- We can take entry in the support area or resistance area. Or we can wait for a true breakout.
Conclusion
Today we have tried to highlight in this lesson how volume helps us to confirm the trends in the market and we have shown it through screenshots. Due to the buying pressure of buyers, we see an uptrend in the market otherwise we see a downtrend in the market when the seller is more active and we see sideways when the ratio between the two is equal. It is important to understand the psychology of the market before trading. By looking at the uptrend and downtrend and determining the structure of the market, we can make a profit. All in all the lesson was very important and an instructive lesson.
Hello @nazmul1, I’m glad you participated in the 4th week Season 6 at the Steemit Crypto Academy. Your grades in this Homework task are as follows:
Observations:
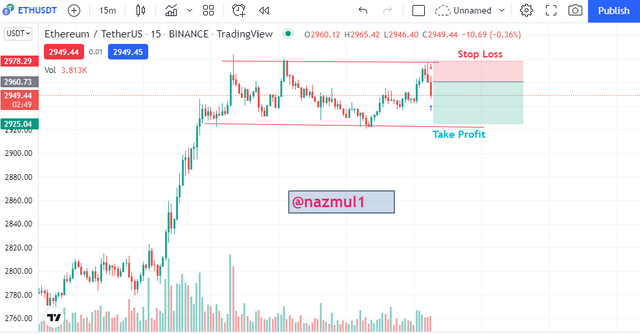
The stoploss could have been better if placed above the resistance level.
Recommendation / Feedback:
Thank you for participating in this homework task.