Crypto Trading with Moving Average - Crypto Academy |S6W2| - Homework Post for Professor @shemul21

Explain Your Understanding of Moving Average.
The two most well-known terms for crypto traders are fundamental analysis and technical analysis. I think it is possible to make a profit in the crypto world only if you have good experience in both analyzes. Fundamental news, such as fundamental analysis, plays a special role in price ups and downs. We need technical analysis to know how far the work will go up and how far it can go down. What I mean is that even if you are experienced in fundamental analysis, you need to know technical analysis to be an ideal trader.
Today this lesson discusses in detail the Moving Average indicator in such Homework. The most used indicator for trend detection is the moving average and it is a well-known indicator worldwide. And everyone knows how important it is for a trader to determine this trend. It is very important to know Trends for all types of traders starting from the long-term trader, short-term trader, swing trader, etc. Because it is very risky to trade against the trend and without much experience, it is usually very difficult to do. Only skilled and experienced traders can make a profit against it but there are many risks.
If we simply say about moving average then it is a trend-based indicator and a well-known indicator that is commonly used in various places starting from the crypto market, stock market, forex market, etc. Let's see a screenshot on tradingview website with a moving average indicator.
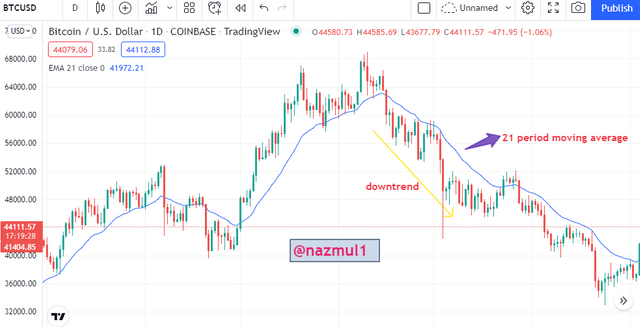
The picture you see above shows why there is a moving average associated with the Japanese candlestick pattern. If we take a closer look at the screenshot above, we will see that it was an uptrend when there was a candlestick pattern above the moving average, otherwise, it is a downtrend when the screenshot has taken the moving average. We can usually determine the uptrend and downtrend moving average of long and short time by changing different timeframes and booking a good amount of profit from here.
What Are The Different Types of Moving Average? Differentiate Between Them.
The Honorable Professor has prepared the lesson with three types of Moving Average and described it beautifully. Let's take a look at the three types of moving averages that he has discussed.
1. Simple Moving Average. (SMA)
2. Exponential Moving Average. (EMA)
3. Weighted Moving Average. (WMA)
The above moving averages are used in different timeframes and from here the correct trend is found. Let's take a look at the differences between them.
- Simple Moving Average (SMA) shows us a line in the desired chart by calculating the average price of a certain period as well as the number of such periods. Exponential Moving Average (EMA) shows a line by calculating the value of today and smoothing. And Weighted Moving Average. Let's take a look at the three types of moving averages that you have discussed (WMA) shows a line by calculating the recent price of the market.
- Simple Moving Average (SMA) is mostly used and suitable for identifying long-term trends. In the case of Exponential Moving Average (EMA) is mostly used for the short-term traders. But Weighted Moving Average (WMA) is used for recent data from charts.
- If we consider fidelity the Exponential Moving Average (EMA) is more reliable when a higher value is used. In the case of Exponential Moving Average (EMA) is more reliable when used lower value. But Weighted Moving Average (WMA) is reliable higher and lower values in a certain period of time in the market.
Identify Entry and Exit Points Using Moving Average. (Demonstrate with Screenshots)
Moving averages are especially helpful in determining the trend of our market. It is very important for a trader to know the movement of the market. If the trend of the market can be determined then it becomes easy to predict what the next movement will be. Traders can book profit from here if they can determine the next movement correctly. I have added two moving averages to answer this question so that we can find the entry and exit points in the market. So let's see a screenshot below.
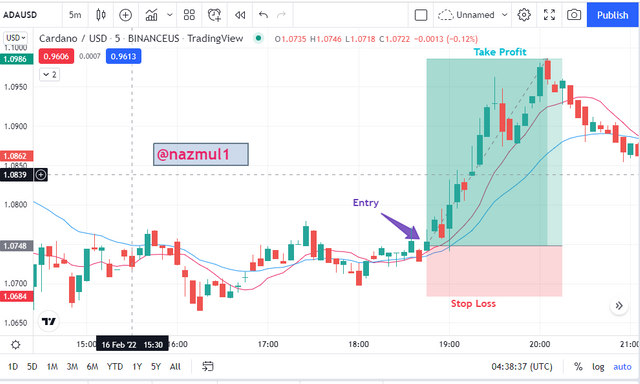
Here I have taken Cardano / USD pair to determine to buy entry using moving average. The moving average here indicates that the market is going uptrend. So here I have shown the buy long position and it has given a good profit.
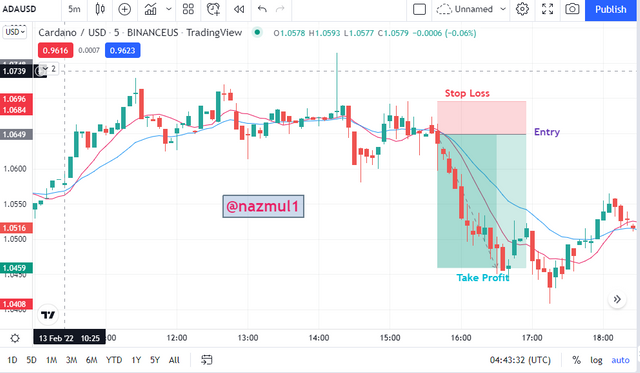
A closer look at the screenshot above shows that the moving average here is giving us a downtrend signal. So I showed the short position here and it gave a good profit. In this way, we can use the moving average to understand the movement of the market and make a profit.
What do you understand by Crossover? Explain in Your Own Words.
We can use multiple same moving averages in the same chart and add different timeframes to it to see how they move differently.
When we associate two of the same moving averages in the same chart and their timeframes are different, they sometimes cross each other. I have taken two different moving averages of different time-frame to see this crossover better way. So let's take a look at how we can calculate the crossover using two moving averages and make a profit from the market and identify where we will enter the market.
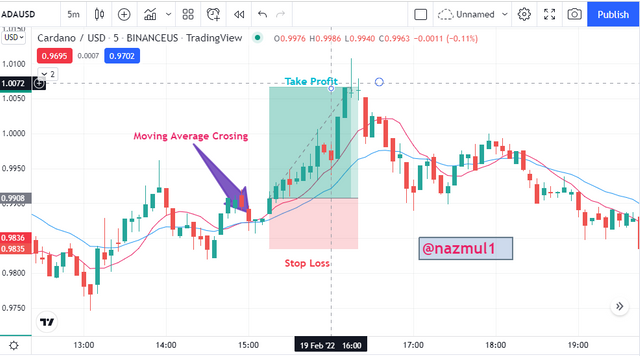
The image I shared with you above is a Crypto pair added between the two moving average charts here. First I have changed the timeframe between them and they are showing different lines in different timeframes. I have marked an entry point so close that if we look, we see that one moving average is going up by crossing another moving average and at the same time the market is giving a hint of the uptrend. So if we can take market entry here then we can make a good amount of profit. In simple terms, moving average crossover means that when a moving average crosses another moving average, it is called cross-over.
Explain The Limitations of Moving Average.
The indicators of technical analysis play a big role and here the traders have fidelity. A market is a volatile market. It is very difficult to predict anything here. It is not as difficult to go against the prediction. No indicator can be a hundred percent accurate. There are some limitations, so let's take a look at these limitations.
- Works on different timeframes but lower timeframes have lower accuracy than higher timeframes.
- I have already said that no indicator can give us indicate 100% accurate trend so we have to use another indicator with this indicator.
- Moving Average I think a slow indicator takes longer to get results from here.
- It is less sensitive than other indicators.
- The biggest limitation here is that moving averages do not consider data that is not average.
- Moving average sometimes gives false signals which is dangerous for a trader. And sometimes fails to diagnose very small fluctuations.
Conclusion
This post on Moving Average is a part of Technical Analysis. Today’s lesson discusses the three moving averages and shows how to make a profit from the market. Using Moving Average, we have learned about where to enter the market and where to exit through this lesson. The advantages and disadvantages of the three moving averages are well illustrated. There are some limitations of the Moving Average that we need to know. All in all the writing on Moving Average was very instructive and important. I would like to thank from the bottom of my heart the professor for giving us such a beautiful lesson. We can profit from this crossover if we can properly realize the crossover.