Steemit Crypto Academy // Season 4 Week 1 // Homework post for professor @allbert
QUESTION 1
Graphically, explain the difference between Weak and Strong Levels. (Screenshots required) Explain what happens in the market for these differences to occur.
Graphical Explanation of Strong and Weak levels
Strong Levels
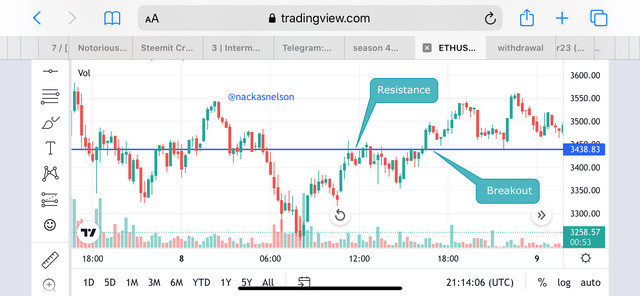
1) Strong Resistance
Strong resistance levels are levels in which prices tend to respect and retest on them a couple of times. When this resistance levels prevents prices from going up in an uptrend. As the prices keeps testing on this level so does it becomes stronger as even after a break it can behave like a support.

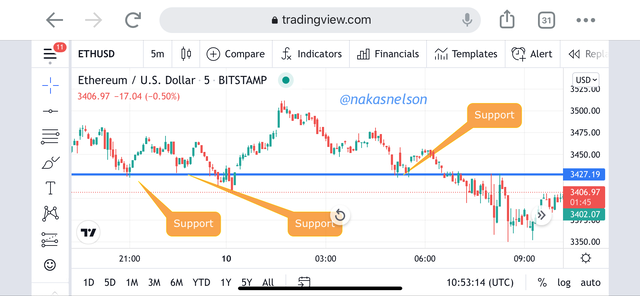
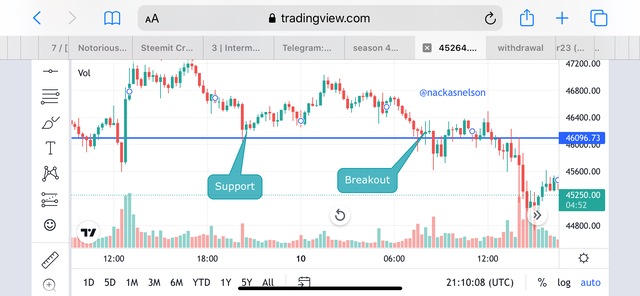
2) Strong Support
Strong support levels are levels in which prices tend to respect and retest on them a couple of times. When this support levels, it prevents prices from going down in a downtrend. As the prices keeps testing on this level so does it becomes stronger as even after a break it can behave like a resistance just as in the case above.
Weak Levels
A) Weak Resistance
In the case of a weak resistance, the prices respects a level once. It is advice not to trade in the scenarios of weak resistances. This is shown as the prices hit a resistance level and later breaks the level this is shown in the screenshot below.
B) Weak Support
In the case of a weak support, the prices respects a level once just as above. It advice not to trade in the scenarios of weak resistances. This is shown as the prices hit a support level and later breaks the level this is shown in the screenshot below.

QUESTION 2
Explain what a Gap is. (Required Screenshots) What happens in the market to cause It.
A Gap
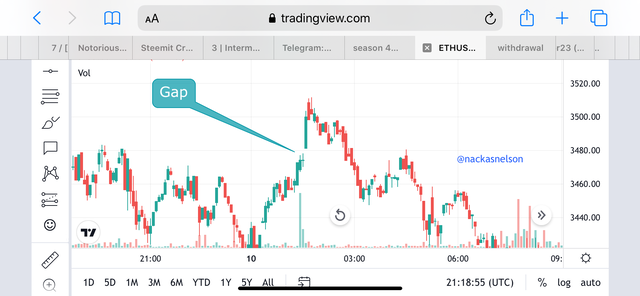
A gap is a scenario which is seen in the prices of assets that presents a gap between the candlestick. We often notice during trading that at times the opening of a new candlestick does not corresponds to the closing of the previous candlestick.
This happens because of the entry of a buy or sell order with a very volume. We can easily see the gap formations in smaller timeframes.
The gap formation can be use properly by traders to maximize profits for themselves which I will be showing below.
they are 3 types of gaps which are
• Breakaway gap
• Runaway gap
• Exhaustion gap

QUESTION 3
Explain the types of Gap (Screenshots required, it is not allowed to use the same images of the class).
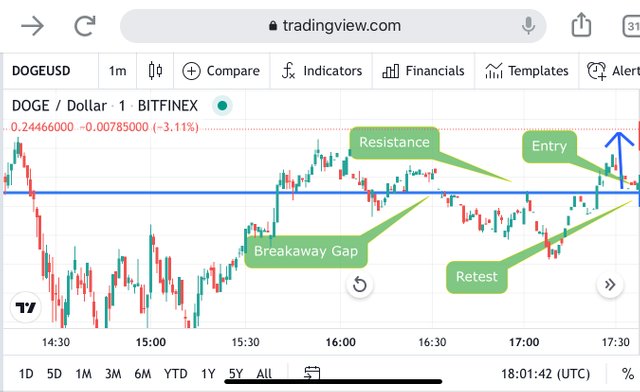
1) Breakaway gap
The breakaway gap is the most common of the gaps and happens to works efficiently when properly analysed and also when compared to the other gaps. The formation occurs when we have a breakout of a lateral movement structure. As shown in the screenshot analysis below, the formation of the gap occurring during a trend which does causes a price skip. The breakaway gap i indicates the formation of a new trend.

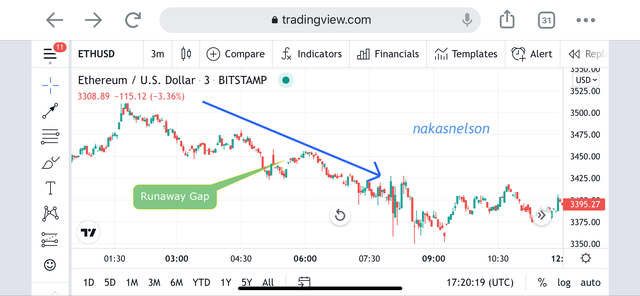
2) Runaway gap
The runaway gap shows the continuation of a trend. We normally do not see the runaway gap very frequently when compared with the breakaway gap. The runaway gap happens during the rise or a fall of prices. This is posed after a retracement and trend continuation.
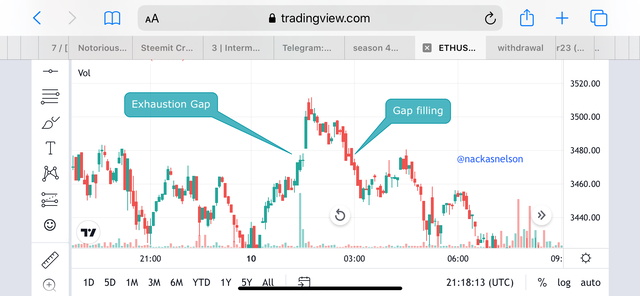
3) Exhaustion gap
The exhaustion gap as the name implies shows tiredness. it appears at the near end of a trend. With the exhaustion gap, we see a minor reversal which fill the gap it made. We can see that in the analysis below.

QUESTION 4
Through a Demo account, perform the (buy/sell) through Strong Supports and resistances. Explain the procedure (Required Screenshots).
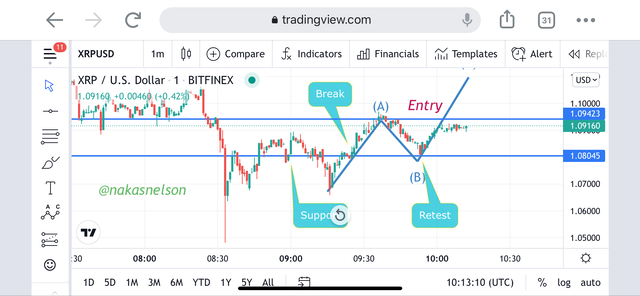
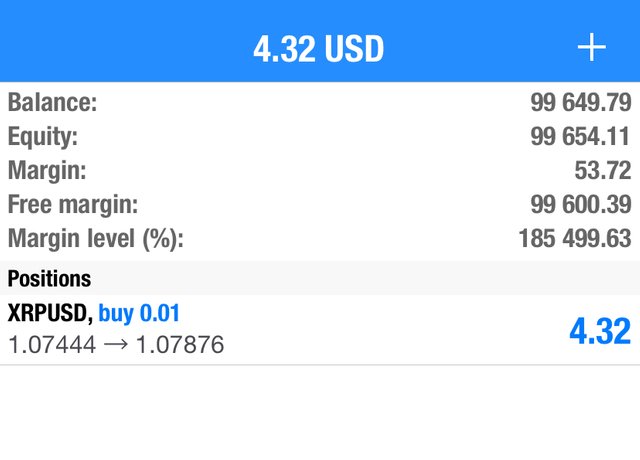
Buying the xrpusd cryptocurrency pair
Trade Entry
For trade entry i will be checking at strong resistance or support levels and applying the break retest strategies as well. As we can see, the level drawn acted as support at some time and break the level. But that level finally acted as a support as prices retest on it. This is explained in the screenshot below.
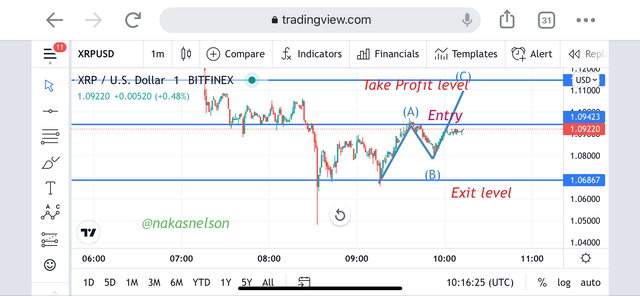
Trade Exit
Exiting the trade will be setting a stop loss level below the retest level. And the take profit level will be set using the stop loss level by setting it to a risk:reward of 1:1

QUESTION 5
Through a Demo account, perform the (buy/sell) through Gaps levels. Explain the procedure (Required Screenshots).
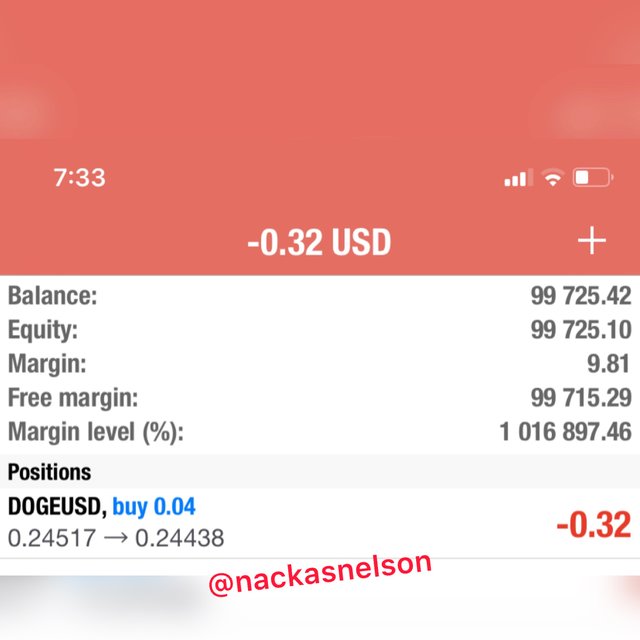
Buying the dogeusd cryptocurrency pair
Trade Entry
For trade entry, I will be using the breakaway gap as it occurs more frequently. I will be looking at strong resistance or support levels associated with the formation of breakaway gap.
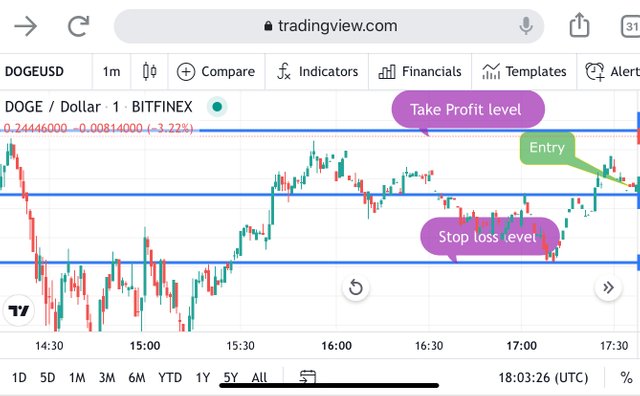
Trade Exit
Exiting the trade is placing a proper stop loss and take profit levels just as above. This is shown in the screenshot below.

Conclusion
In a brief summary, we have seen the strong and weak levels. This levels include strong support and resistance levels and weak support and resistance levels. With the proper usage of strong support and resistance levels, traders can guarantee profits from them.
We have also seen gaps which is a situation is which the opening of the new candlestick does not corresponds with the closing of the precious. We have also seen the three types of gaps which are the breakaway, runaway and exhaustion gaps.
CC: @allbert