Crypto Academy / S4W2 || Basic Trading Strategy Using The Harmonic AB = CD + Fibonacci Pattern By prof @lenonmc21
1.) Define in your own words what Harmonic Trading is?
Harmonic trading is an analysis tool that traders use in predicting future trade and prices of a market movement and are also a part of trading strategy. So, therefore, Harmonic trading is the combination of patterns and mathematical calculations so as to predict future prices on the assumption that patterns of history repeat themselves. It's is important to understand and know how to identify the patterns then be able to know when to enter and exit a position with the the probability of the history repeating itself. Harmonic trading in simple words is the repetition of trends in the market.
This trading tool Harmonic Trading depends solely on the Fibonacci sequence principle which was designed by an Italian mathematician who is known by the name Leonardo Pisano. This sequence shows how prices can alternate from calculations to previous prices.
Harmonic trading patterns is of 7 types which are
1.) The Butterfly pattern
2.) The Crab pattern
3.) The Gartley pattern
4.) The Bat pattern
5.) The Shark pattern
6.) The Deep Crab pattern
7.) The ABCD (or AB=CD) pattern
And among these 7 the most used patterns are the Butterfly, Gartley, Bat and Crap patterns.
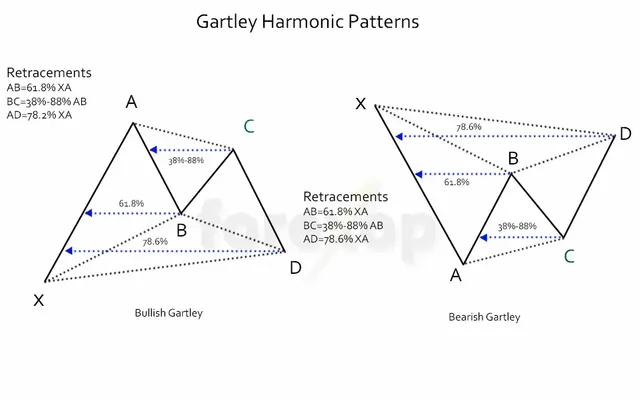
2.) Define and Explain what the pattern AB = CD is and how can we identify it?
The ABCD also know as the AB=CD pattern. This Harmonic trading pattern is the easiest pattern and the most used pattern.
This pattern is solely made up of three movements and 4 points that is the AB which is the impulsive movement, the BC which is a corrective movement and DC which is an impulsive movement and it moves in the same direction as the AB and base on the Fibonacci retracement they are considered to be the legs. With the BC leg at 61.8%,, retracement of the AB line and the CD leg has a 127.2% increment of the CD leg.
How to identify the ABCD
We need to be focus enough to identify the large swing movement that is in the market
Identity Bullish ABCD pattern.
Downtrend
Reading the chart and getting the vital information of the ABCD pattern starting from point A to D indicating a rise in the price movement of the market as point D is reached. After which it indicates a rise as point d is reached.
 Bullish ABCD Pattern
Uptrend
Reading the chart and getting the vital information of the ABCD pattern starting from point A to D indicating a fall in the price movement of the market as point D is reached.
 Bearish ABCD Pattern Bearish ABCD Pattern
A-B leg
On the A-B leg, , you will see the market trending downward on the downtrend from A to B as the prices fall and Upward on the uptrend as its prices riseB-C leg
From point B the prices change their direction following a downtrend indicating a fall in prices creating the B-C leg.C-D leg
At the CD leg, the trend move in the same direction as the A-B leg, and at point D is a Fibonacci extension being between 127% to 161.8% of the B-C leg.
3.) Clearly describe the entry and exit criteria for both buying and selling using the AB = CD pattern?
Entry Criteria For Bullish Pattern( Buy Order)
After identifying the points A, B, C, and D on the downtrend, the ABCD pattern is usedd to identify the reverse position. After which we identify the points then we confirm if the retracement of the B-C is in the Fibonacci sequence range of 61.8% to 78.6% and also know if the C-D is in the Fibonacci range of 121.2% to 162.8% and if all these ranges are correct that we can say the pattern is a great one and then we analyze other signals that are if the next candlestick form is bullish, then it's a good pattern as well.
Sell Entry with ABCD pattern
When begin by identifying the A to D points in an uptrend Market so that we enter a sell at a reversal point. Then we identify and confirm the retracement of B-C in the Fibonacci sequence range of 61.8% to 78.6%and also be sure of the movement CD is within the
121.2% to 162.8% Fibonacci range, then we are sure of the sell entry knowing is a good pattern. Because using just one signal to analyze a trade is not advisable, we will be analyzing the market signal for the sell option and if D is in the price resistance area, then that will be a great entry point to place the sell order.
Buy and Sell Exit
A trader needs to be cautious enough about where and when to enter and leave a market knowing that placing the Stop Loss and Take profit position in the market is very important. Not to be so greedy it is advisable to take a ratio of 1:1.5 or 1:2 for a sure successful trade. Therefore, we take Stop loss at 1.5% above or below where D appears and setting the Take profit at 3%from D.
Make 2 entries (Up and Down) on any cryptocurrency pair using the AB = CD pattern confirming it with Fibonacci.
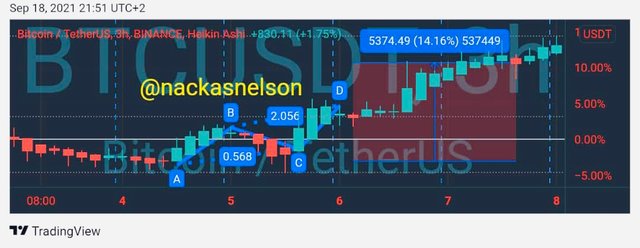
Two entries of buyinging and sellinging of the pair BTC/Tether so as to illustrate the up and down using the ABCD pattern and also have confirmed this illustration using the Fibonacci sequence and seen on the screenshotted charts below
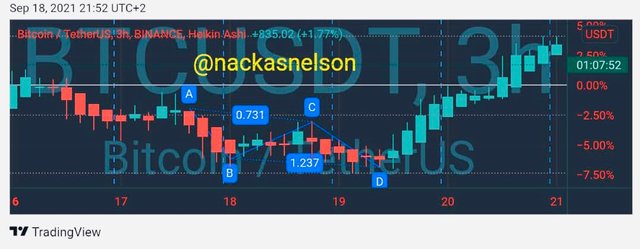
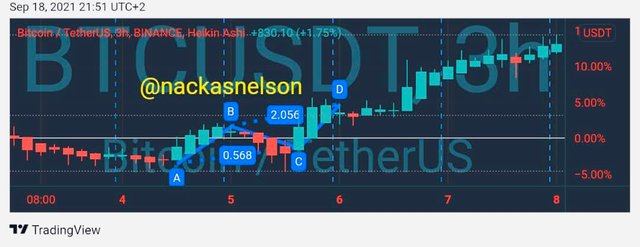
Buy Order
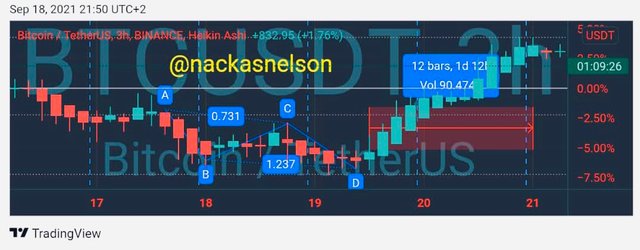
Sell Order
Conclusion
After a great study of prof @lenonmc21’s lesson on the harmonic trading pattern of ABCD and doing research to broaden my knowledge more I can say it was a thought lesson and as a futuress trader,, I can say I have head enough knowledge on when to enter and leave the trade and also to a successful trader.
Cc: lenonmc21