Greeting everyone, it's another assignment to tackle in the steemit crypto academy's series. It was a great lesson taught by prof @reminiscence on a technical indicator. In this post, I will be answering the questions that followed the lesson.

1.) a) In your own words, explain Technical indicators and why it is a good technical analysis tool.
b) Are technical indicators good for cryptocurrency analysis? Explain your answer.
Technical indicators are interpreters in the market providing the necessary information by translating them to easily read signals thereby determining the buy and sell of a cryptocurrency pair. These indicators are mathematically base equations that produce values that can be plotted on a chart. The average moving value (AMV) calculates the average price of a crypto pair in the past and produces its points on a chart implying that, as the crypto pair is moving forward, the moving average plots its points on the chart with the updated information that is being provided. The moving average provides you with clear information as to which direction the crypto pair is going.
With the world becoming more of a digital environment so is the development and creation of new and variable indicators but all working to be able to determine and confirm the direction of a cryptocurrency trading pair.
One of the most common sites known as Tradingview.com provides and automatically adds indicators to your chart thereby leaving us with the option of interpretation. It is important in every operation to know which indicator to use taking into consideration their differences because each indicator provides unique information so being familiar with all will be an advantage as you carry out a trade.
Without the experimental assurance of a technical indicator being 100% successful due to its history being obtained from pass price data they are not definite of the future trend, it is good to try out a number of these indicators before carrying out a trade.
Technical indicators are good analysis tools because they can predict a trade, confirm, and alert investors of when to enter and leave a trade.
Predicting a trade
Here, the technical indicator helps an investor to predict the price movement of how the future crypto trading pair would look like.
Alert
The technical indicator alerts an investor when to enter and leave a trade by signaling.
Confirmation
Technical indicators are good confirmation tools. They can test other technical analysis tools and are reliable thereby acting as support and resistance.
There are three categories of technical indicators namely, Trending, Oscillating, and Volume indicators.
1.) b) Are technical indicators good for cryptocurrency analysis? Explain your answer.
As I said earlier technical indicators are good for technical analysis and very important for them to be us in a trade. Because technical indicators are historical meaning their assuming is made from past data prices it is very important before getting into a trade, research should be done on the other indicators to minimize the errors on the analysis.
Now to know if a technical indicator is good for cryptocurrency analysis we will be talking about the categories of the technical indicators
Trending indicators are indicators that follow and identify the trend of a trading currency pair. With an advantage in entering a trade when the pair just starts to trend and leave before it stops trending, then it will be a successful
With oscillating indicators, it is the back and forth movement of the currency pair as the currency prices rise and fall, the strong and current trend of the trading pair of the oscilating indicator trend is also at risk of losing its momentum. If a currency is overbought and the oscillating indicator is too high this indicates a risk of a turnaround.
Indicators provide trading signals for traders which help them to reduce the stop-loss size and thus increasing the winning ratio and also providing support and resistance areas which are the stop-loss target and take profit areas.
1.) c) Illustrate how to add indicators on the chart and also how to configure them. (Screenshot needed).
Here on this question, I will be illustrating how to add indicators using the tradingview.com site as my reference of all my screenshots and will be analyzing the Steem/BTC cryptocurrency pair.
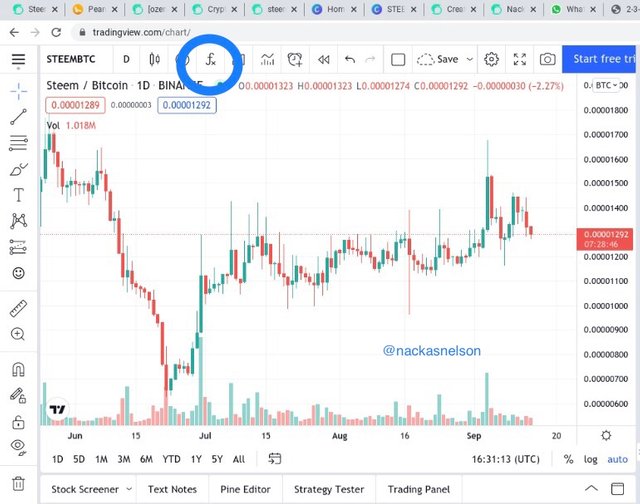
When the graph is open, we can add the required indicator by clicking on the f(x) icon that is cycled in blue as seen in the screenshot above.
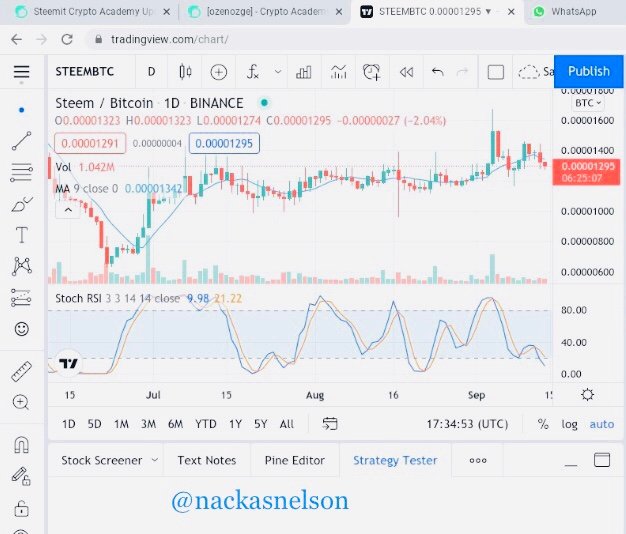
When f(x) I searched for moving average and the RSI which are all included in the chart.
To be able to create the indicator, it is done by right-clicking on the indicator which is selected when choosing the setting in the list of options then that is clicked, various options like sensitivity and color can be changed on the indicator.
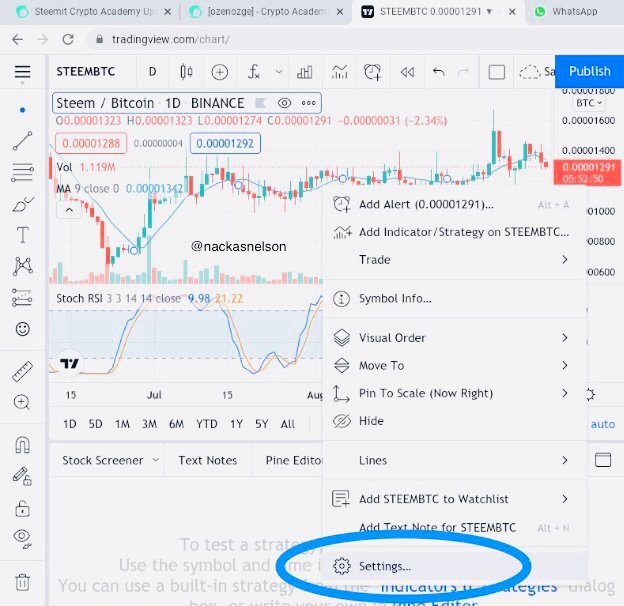
Right-clicking to select settings
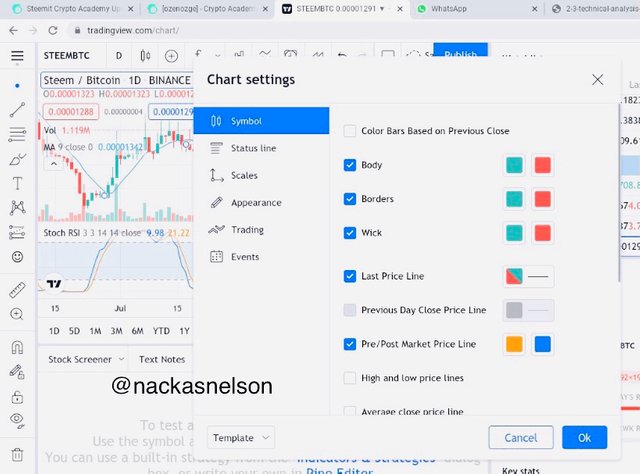
Setting the Indicator color
.
2-a) Explain the different categories of Technical indicators and give an example of each category. Also, show the indicators used as an example on your chart. (Screenshot needed).
There are 3 types of technical indicators which include;
Volatility Based Indicators
Here there is always a fluctuation in the market price of a commodity altering it up and down. This indicator helps a trader on when to buy with a low price and when to sell when prices get high. The fluctuations of these trades can be known as Volatility Based Indicators.
An example of this indicator includes the Average True Range (ATR)
On the graph above, ATR is being added to a BTC chart
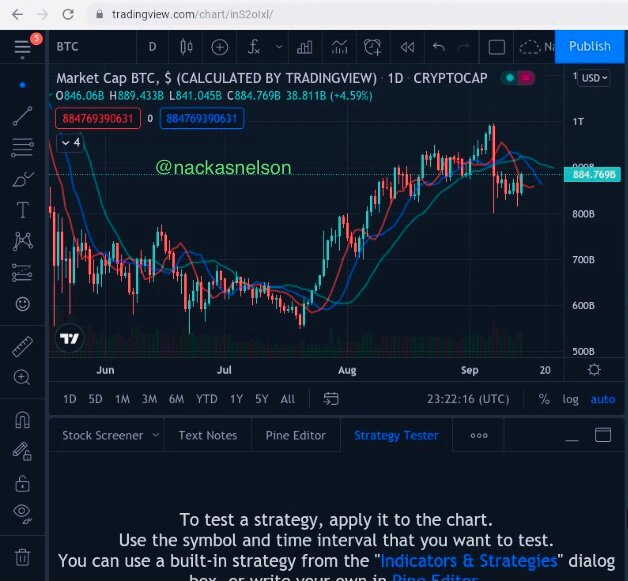
Trending Indicators
These are trending indicators that's show the direction of a trading pair and its potential levels of support and resistance. These indicators do act as both resistance and support. They are constructed by looking for the average closing price of the trading pair at any given time with the points being plotted on a price chart. This indicator helps us understand the direction of a trend and whether a trend is strong or can't be understood.
Moving Averages (MA), Average Directional are types of trending indicators.
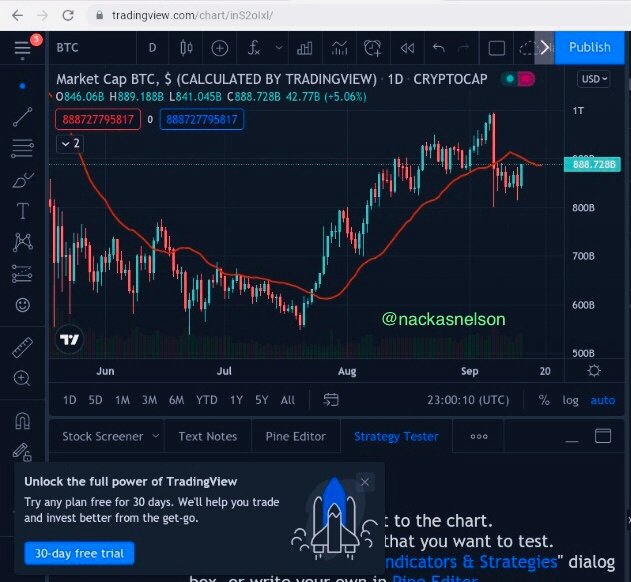
Example of a BTC graph where a moving average indicator is being added to and it can be seen that both the trend and MA Indicator are in the same direction.
Volume Indicator
This indicator gives a buying and selling activity establishing whether the market rises or falls and winning the change in price if higher or lower. The volume indicator works well as a convergence and divergence tool while keeping track of the sequence of highs and lows.
An example of this indicator is the On-balance volume, Klinger oscillator
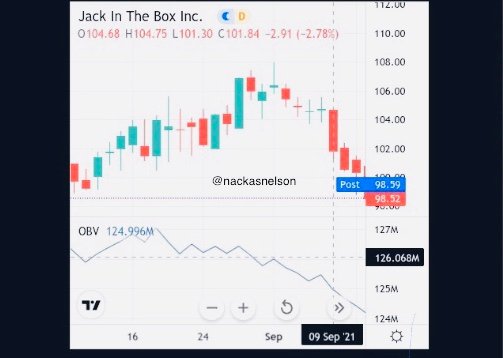
The chart of an on-balance volume.
< center>2.b) Briefly explain the reason why indicators are not advisable to be used as a standalone tool for technical analysis.
It is normal for the brain and why not machine makes mistakes so are indicators. Indicators in the same light do not always provide accurate results thereby making it vulnerable to give false signals and also give a misguiding market price. So traders should not only base their predictions on a single indicator and also get updates on different indicators to help them minimize every market error.
< center>2.c) Explain how an investor can increase the success rate of a technical indicator signal.
For investors to increase their success in the market, they should be able to understand the different indicators available and also be current on the signals being given by the indicators thereby knowing how and what time is advantageous to enter a trade. Investors should also have good timing of when and what time of the day to enter a trade and be good to be able to configure their indicators for efficiency and accurate results.
.
Conclusion
It was a great lesson understanding Technical indicators adds as an advantage to an investor and it helps investors understand the market and how to be successful on trades.
.
Thank you professor @reminiscence01 for this awesome lesson.
Hello @nackasnelson , I’m glad you participated in the 2nd week Season 4 of the Beginner’s class at the Steemit Crypto Academy. Your grades in this task are as follows:
Recommendation / Feedback:
You have explained very well. But i encourage you to be more technical in your explanations. Thank you for participating in this homework task.