FLASH CRASH in Amazon (AMZN) = NEVER PLACE STOP LOSSES WITH ONLINE BROKERS
Hi Friends,
A couple of weeks ago, I wrote that it is important to never place stop losses with your online broker (https://steemit.com/trump/@mwanacomete/how-one-bad-trade-got-trump-elected)
"ALWAYS keep your trailing stop loss levels completely private. Never share them with your broker.
Why? Because many times your broker will enter your stop loss in the market on a GTC (good-til-canceled) basis. That means other traders can see where your stop is set.
If the market gets close to that point and lots of investors have set stops at about the same price, the market makers will move the market to trigger those stops, knowing once the selling is done, the price will quickly rebound.
Never enter your stops with your broker. NEVER!"
Today proved that it happens, and I have the perfect image for you.
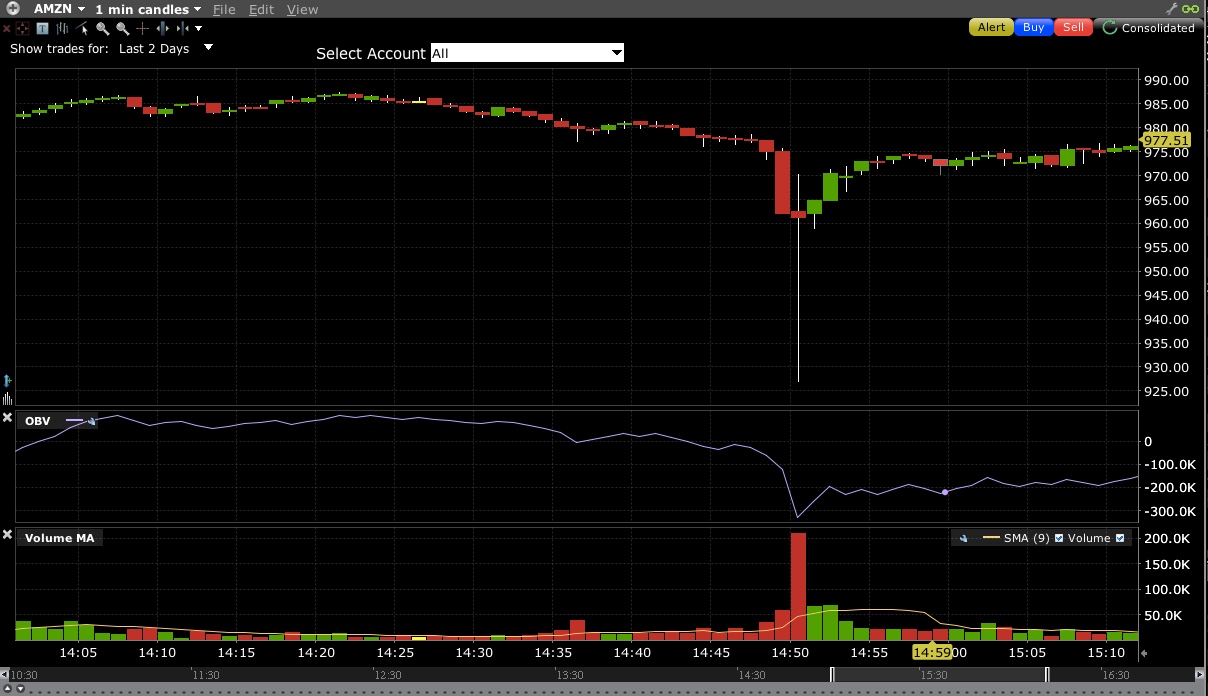
This is a 1-minute chart of Amazon (AMZN) in the 70 minutes between 14:00 and 15:10. Each candle is 1 minute long. On this chart, the green candles represent a minute in which more buying occurred than selling, and red the opposite.
The body of the candle represents the difference between the price at the open and the price at the close. Do you see the wicks? They show the maximum distance the stock moved during that minute.
Usually the wicks are very small -- after all, this is a 1-minute chart, and not a whole lot of buying/selling occurs in a minute. The longer the time-frame, the larger the wicks can get on very volatile stocks.
Today there was a lot of selling pressure on AMZN -- profit-taking and rotation out of tech into other sectors -- but it happens in step-wise, orderly fashion, even when a lot of people are on the same side of the trade.
The purple line below is OBV -- On Balance Volume -- which measures buying and selling pressure by adding the total positive (buying) and negative (selling) volume and creates a cumulative number. The absolute number isn't all that important, but the trend is easy to see, especially over longer time-frames (daily charts, for example).
The lowest frame of the screen shows volume. The scale on the right is the number of shares trading in that minute, and the color of the bar corresponds to the overall direction of the volume. The beige line is a simple average that moves up and down with the change in volume.
As you can see, both volume and OBV are basically even, steady, flat. The volume bars are unremarkable and stay within their average. The OBV candles are small and fall between 975 and 985 (price, in USD), until about 14:48, when a larger than usual red candle appears, the OBV slopes downward, then another red candle, 5 times as long appears 14:49-14:50, the OBV crashes, and then a very strange candle appears between 14:50 and 14:51.
This is the crucial candle.
It opens at about 962 and closes at 961, a one-point move like so many of the previous candles. But... it is almost all wick. In other words, price moved crazily -- in that one minute price oscillated between 970 and 927.
That, friends, is a FLASH CRASH, caused by high-frequency trading algorithms.
They compute where stop-losses are clustered and smash price down by selling hundreds of thousands of shares in an instant, unleashing a virtual tsunami of selling force that no individual investor, not even all of them together, can resist. You can see this distinctly in the spike in volume which reaches 200,000 shares after a steady average of some 25K.
All of those investors who had their hard or trailing stop losses set anywhere between 927 and 961 got their shares ripped from them. And the same algos lapped those shares back up at 5% cheaper than fair market value.
THIS WAS A HEIST.
It bears repeating -- keep your stop losses private. Be disciplined and follow them. You can close out your own trades. You don't need it to be automatic. (If you do, you either are not paying enough attention, or are too invested. Use TradeStops and pare your risk down and sleep better at night.)
Bye for now!
Great analysis. I wish more people were aware of what open thievery HFT is.
Thanks for comment. I was trading out of AMZN options at the time and caught it. It made my jaw drop. I hadn't seen that live like that since Aug 2015, but then it was more wide-spread (I lost of a lot of stock on whatever day that was, the 25th or so, because I had my stop losses programmed into IB. I didn't know better.
If you have people in your feed/circle who trade, feel free to resteem. They might find it useful.
Have a good one!
@cmtrading -- did you see this today???
Nice post! I will follow you from now on. +upvote
Congratulations @mwanacomete! You received a personal award!
You can view your badges on your Steem Board and compare to others on the Steem Ranking
Vote for @Steemitboard as a witness to get one more award and increased upvotes!