Crypto Trading with Price Action - Crypto Academy / S6W2- Homework Post for @reminiscence01
Cover Page designed by me, @msquaretk | designed with imarkup app
It's week 2 of the season 6 in the Steemit Crypto Academy. In this post, I am going to be answering the questions given by Professor @reminiscence01 after his lecture on "Crypto Trading with Price Action." He explained that said topic very well and and the importance of trading with price action. Follow me closely as I answer these questions one after the other.

1. Explain your understanding of price action.

There are three major methods of analysis which traders use to analysis and predict direction of price. These methods are, fundamental analysis, sentimental analysis and technical analysis. In the past, fundamental analysis is the most used method to the extent that financial analysts believed that the technical anlaysis is mystical. But these days, people are now using the technical analysis. As a matter of fact, many traders are now beginning to use technical analysis more.
There are problems with fundamental analysis and sentimental analysis. Most of the information needed for analysis are not easily accessible as that of technical analysis which can be gotten on the price chart. Hence, some traders prefer technical analysis as they can easily predict the direction of price by looking at the price chart.
The representation of traders' emotions and psychology is the movement of price which is shown on the chart, hence the reason for price action. Price action helps us to understand what is currently happening and what will happen in the future by our prediction with the past historical price. Price action is very important in technical analysis as price action traders depend only on the reading of the graph/chart.
Price action traders use tools such as support and resistance, candlestick and chart patterns, market structures, technical indicators, volume and other tools on the chart to predict the direction of the market. They study what has happened in the past to be able to know the direction the price will follow. It's often believed that market repeat the patterns. So by studying the patterns which has occurred in the past, traders take opportunity of following the price when such patterns repeat themselves.
The use of price action makes the retail traders to be able to follow the directions of price. There are some institution traders, whales who have in their position large cryptocurrency. These people or organizations can influence the direction of price. But with the use of price action, retail traders can predict the direction of price and be able to follow them when they move in a certain direction, but it requires that the traders are very skilled in the use of technical tools to be able to predict with some level of accuracy.
We can see how useful the price action is. The use of price action help traders to know where to enter the market and where to exit.

2. What is the importance of price action? Will you chose any other form of technical analysis apart from price action? Give reasons for your answer

Price action can help us determine the price trend of an asset and be able to trade in the direction of the trend.
For example, the use of market structure, we can quickly see the trend. When the price moves in a descending order with series of lower lows and lower highs, the trend is said to be bearish and when it moves in an ascending manner with series of higher highs and higher lows, then trend is bullish or uptrend.
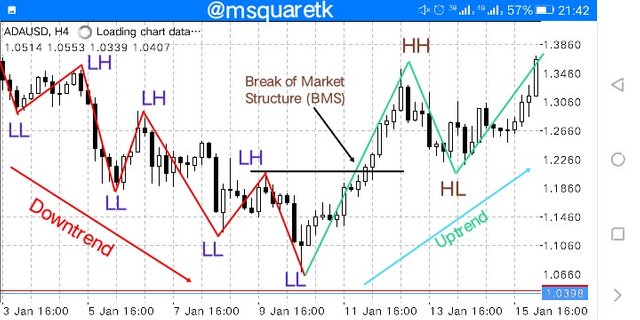
Screenshot From Mt4 App
In the screenshot above, you can see how market structure has helped us to identify the trend. A price action traders trading the downtrend will wait until price pulls back and confirm his entries with one more tool and trade it down. Then, when the price breaks the last lower high (see BMS in the screenshot) it's a signal that the downtrend was coming to a close and that the buyers wanted to take over the market. As as we can see, the trend reversed.
Price action shows the emotions and Psychology of Buyers and Sellers
One of the importance of price action is that it shows the interaction between the buyers and sellers. The emotions and psychology of traders are reflected on the price chart by patterns formed on the chart. Some patterns show what the buyers or sellers are doing at a particular time. Knowing what they are doing will help traders know which direction to join.
Price action helps traders in determining entry and exit points in the market
Unlike fundamental analysis where you may not have so much information about entry and exit in the market, price action gives enough information which can be used to determine the points of entry and exit.
Price action aid in filtering noise and false signals
This is another importance of price action, it helps filter noise and false signals. When traders use technical indicators on the chart, they use price action to confirm the signals given by these indicators before taking position in the market. Since technical indicators give false signals, price action will show if the signals are false or not. Also, noises on the chart can be filtered with the use of price action. When the market is ranging on a particular timeframe, traders can switch to higher timeframes and see the normal trend.
Will you choose any other form of technical analysis apart from price action? Give reasons for your answer
Yes! I will choose any other form of technical analysis to combine with price action. Having one tool is not enough. One must have enough tools so as to predict the direction of price with some degree of accuracy. Sometimes price movement can be very confusing but when you add some other tools such as technical indicators with price action, you will be able to confirm exact direction of price.
Other forms of technical analysis are also useful and can be combined with price action to increase the effectiveness or success rates. For example, some technical indicators give buy and sell signals which traders use to take position in the market. For instance, if a double top pattern is formed on the chart, it is a reversal pattern. But, not all double top reverse the price. Combining indicator such RSI or Stochastic oscillator with it can help the trader know whether the pattern will reverse the price. If for example RSI is overbought when the double top forms, then traders can be sure that the pattern will reverse the price.
Also, with the use of other forms of technical analysis, we can minimize the risk. Some price patterns expose traders to more risk but when you combine other tools with such patterns, you can minimize risk and thereby maximizing profit. So, I think it's wise to combine other forms of technical analysis with price action to increase the success rate.

3. Explain the Japanese candlestick chart and its importance in technical analysis. Would you prefer any other technical chart apart from the candlestick chart?

In this part of the task, I'm going to be explaining Japanese candlestick chart, its importance in technical analysis and give my opinion on whether to choose any other type of chart for analysis.
I have explained earlier that the price chart shows how buyers and sellers interact in the market. When buyers are in the control of the market we will see the price increases and when sellers are in control, the price will decline. But there's a particular thing which is shown on the chart to see how the price is increasing or decreasing. What shows this increment or decrement in price depends on the type of chart the traders use.
There are different types of chart which can be used to trade cryptocurrencies. Some of the types of chart are
- Line chart
- Candlesticks chart
- Heikin-Ashi
- Bar chart
- Hollow chart
Line chart is a simplest form of chart. It contains a single line which connects the closing price of an asset over a period of time. Of all types of chart used in technical analysis, japanese candlestick chart is used mostly because of its importance. The candlesticks chart shows some important information which some of the other types do not show. For example, line chart only shows the closing price of an asset, where as, candlestick chart shows low, high, close and open of the price.
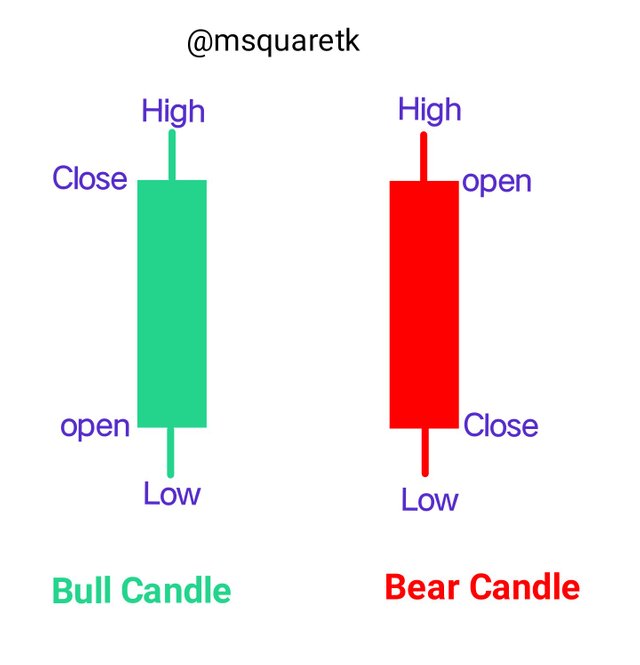
Image designed with imarkup App
In the screenshot above, you see an example of Japanese candlestick. It has low, high, close and open of the price. Specifically, there are bull and bear candles. According to the default settings on trading view, the bull candle has a color of green while the bear candle has red color. A candle is said to be a bull when the closing price is higher than than the opening price. A bear candle has closing price lower than the opening price.
The uniqueness of Japanese candlestick is that, every candles convey one information or the other. And this information is very useful for traders in predicting the direction of price of an asset. For example, the length of a candle shows the momentum with which buyers or sellers are going in a direction. It also depicts volume in the market.
Forces of supply and demand which determines or influence the direction of price could also be shown be Japanese candlestick. When demand is greater, the price of an asset will rise and when the supply is greater, the price will fall. With the use of support and resistance levels on the chart, we can predict whether the price will fall or rise.
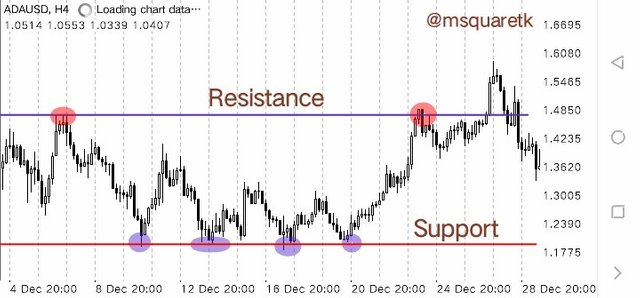
Screenshot From Mt4 App
In the screenshot above, we can see how some candlestick pattern form at the support and resistance and caused the price to bounce back. Candlesticks chart are so useful for traders because of all these information they show.
Would you prefer any other technical chart apart from the candlestick chart?
Well, to me, candlestick chart is very okay for me because I have been trained with it. However, the other type of chart I use together with Japanese candlestick chart is line chart. The reason I prefer using this type of chart with candlestick chart is that it shows the overall trend of an asset, especially in higher time frames.
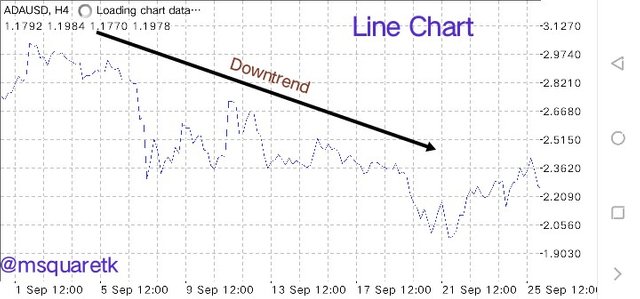
Screenshot From Mt4 App
Sometimes, there could be noise on the candlesticks chart, but if I switch to line chart, I will clearly see the overall trend and know which direction the price of an asset is following. Hence, I combine the line chart with the candlestick chart to increase the success rate of my analysis.

4. What do you understand by multi-timeframe analysis? State the importance of multi-timeframe analysis.

Multi-timeframes analysis is the use of different timeframes to analyze an asset to be able to see important information which trades need. Multi-Timeframes analysis have been very useful for traders. It deals with the use of all time frames to take advantage of the direction of price.
Higher timeframes are basically used to determine the overall price trend while lower timeframes are used for entry and exit.
The use of multi-timeframes depends on the individual trading style and the type of trader one is. Swing traders will use monthly and weekly time frames to determine the overall trend of an asset while they will use daily and H4 chart to take entry and set their stop loss and take profit. An intraday traders will use daily and four hour timeframe as their higher timeframes where they will determine the overall trend while entry and exit will be taken on H1 and 15 minutes. A trader who does scalping may stick to 15mimutes, 5 minutes and take entry on 1 minutes or even second time frames.
Whatever the type of trader you are, the most important thing is to use higher timeframes to confirm the overall trend and go to lower timeframes to take entry and exit.
State the importance of multi-timeframe analysis
Multi-timeframe analysis is very important for traders. It helps traders determine the overall trend of an asset. By looking at the higher time frames , traders will see the price trend.
It also filters noise. For example if price is ranging on a timeframe, switching to a higher timeframes will filter the noise and therefore making the traders to understand the real direction of price.
In addition, with the use of multi-timeframes, risk can be reduced. For example, if higher timeframes is used to analyze the direction of price, traders can go to lower timeframes to take entry and thereby reducing the risk which may be large if the entry is taken on the higher timeframes.
Further, the use of multi-timeframes help to be sure of our analysis. For example if on a higher timeframes we saw a bearish pattern which we believe we send the price of an asset downward and on switching to lower timeframes we keep seeing other bearish patterns, that will strengthen the analysis and we will be confident to take a sell position when every criteria is met.

5. With the aid of a crypto chart, explain how we can get a better entry position and tight stop loss using multi-timeframe analysis. You can use any timeframe of your choice.

In this task, I'm going to be explaining how to get a better entry position and tight stop loss using multi-timeframe analysis on a cryptocurrency.
I'm going to use Mt4 app for this task. I will analyze from higher time frames to lower timeframe. On the chart of AUDUSD, daily timeframe, he price of the asset had been in a downtrend for sometime. It retraced or pulled back before it continues its bearish movement. The point where the price reversed back was a point of rejection, resistance level. And fortunately a reversal pattern, evening star pattern formed at this resistance level giving us more assurance that the price will rally down. Now, if we are to take entry based on this timeframe, the stop loss would be 380 points. See the screenshot below.
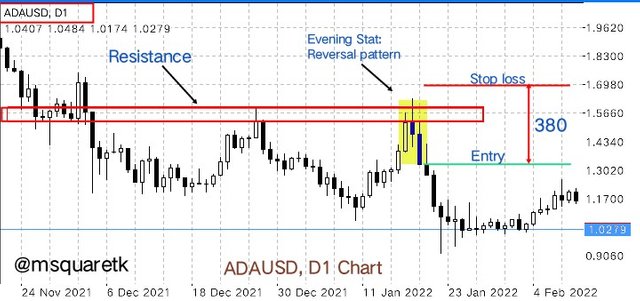
Screenshot From Mt4 App
Now, switching to H4 timeframe to see if we can find a better entry as well as see the stop loss reduce. On switching to H4 timeframe, i could see that a better entry for the sell position would have been at the bearish Engulfing candlestick pattern that formed at the resistance level. This would have reduced the stop loss to 200points if the stop loss is placed just above the pattern.
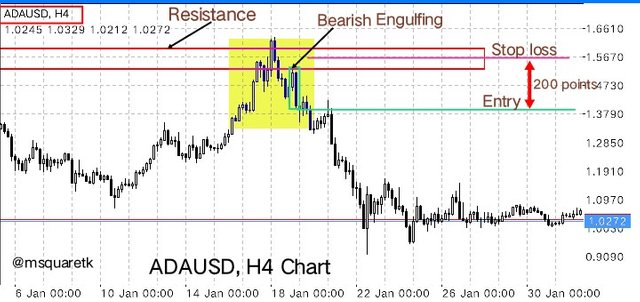
Screenshot From Mt4 App
Analyzing further on H1 timeframe, it can be see that the price formed an uptrend to the resistance level showing a series of higher highs and higher lows. As it will be seen in the screenshot below, the price could not continue the trend when it got to the resistance level. The trend broke. A better entry would be at the retest of the resistance level and stop loss would have been placed above the last high created before the break of that structure. The stop loss would have been reduced to 100 points.
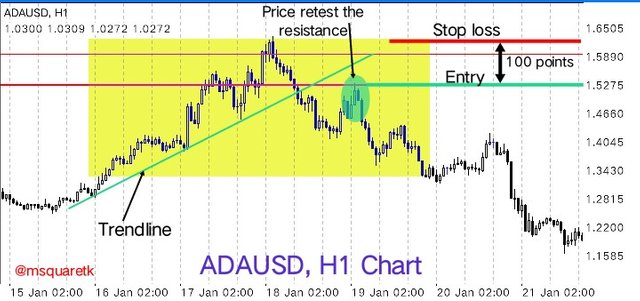
Screenshot From Mt4 App
Going further again to M15 timeframe, at the resistance level, a reversal pattern called evening star formed. This would be a point to place a sell order. Thanks stop loss would have reduced to 55 points . See the screenshot below.
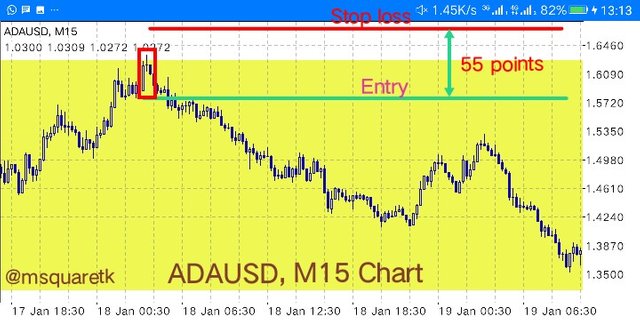
Screenshot From Mt4 App
Then, I still went further to M5 timeframe. On this timeframe, a reversal pattern called head and shoulder formed at the resistance level. This type of pattern when it is formed at the peak of the trend, it will send the price of an asset downward. The entry would be at the break of the neckline (Marked with black trendline in the screenshot), the the stop loss would be at the head level. You could see that if the entry is taken on this timeframe, the stop loss would just be 40 points.
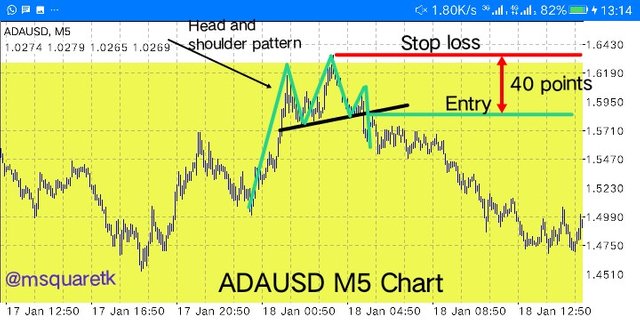
Screenshot From Mt4 App
We can now see that importance of multi-timeframes analysis. If he entry was taken on a daily timeframe, the stop loss would be 380 points whereas if the entry was taken on 5 minutes timeframe, the stop loss would just be 40 points. See how risk could be reduced with the use of multi-timeframes.

6. Carry out a multi-timeframe analysis on any crypto pair identifying support and resistance levels. Execute a buy or sell order using any demo account. (Explain your entry and exit strategies. Also, show proof of transaction).

In this part of the task, I am going to be carrying out a multi-timeframes analysis on a pair. I will be using the MT4 app for the task.
Opening the chart of LUNAUSD to H4 timeframe, I saw the price at a resistance level. Overall, the price has been in a downtrend for some time. But currently at the current, it seems that the market wants to complete its pull back. Noticing that the price is on a key resistance level which is capable of pushing the price downward, I marked the support and resistance. See the screenshot below.
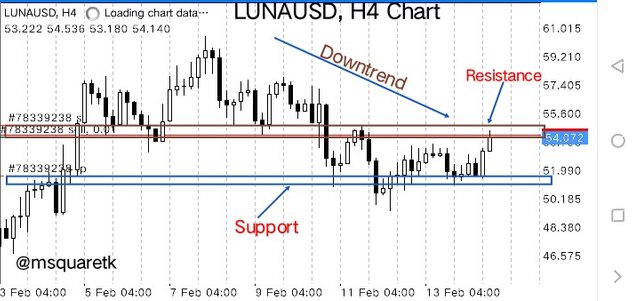
Screenshot From Mt4 App
Then, upon marking the support and resistance on H4 timeframe, I switched to H1 timeframe to see what's happening on it. On the resistance level, a bearish reversal candlestick pattern, hanging man formed. This is another confirmation that a bearish move will soon began and the downtrend will continue its movement. See the screenshot below.
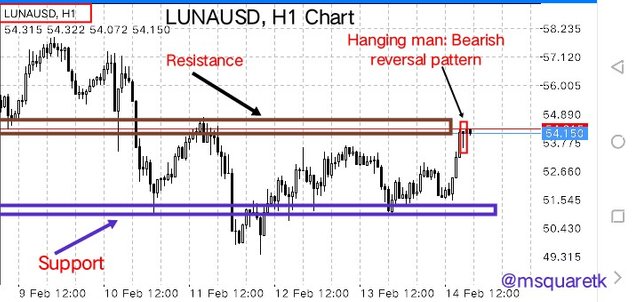
Screenshot From Mt4 App
Then, next is o go to lower timeframe to confirm what's forming there. I switched to M15 timeframe. You will see the screenshot of LUNAUSD, M15 Chart below. But to really see the candlesticks forming at the resistance level, we will need to zoom in to be able to see.
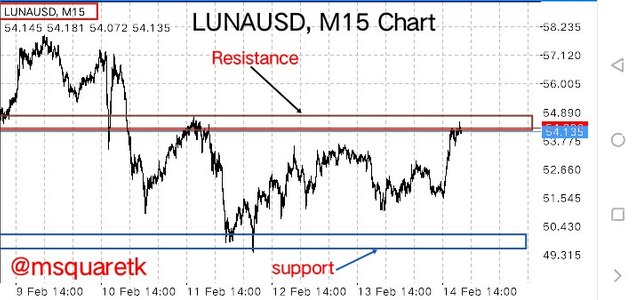
Screenshot From Mt4 App
So, upon zooming in, a shooting star candlestick pattern is seen forming on the resistance level. Shooting Star is also a bearish reversal pattern. When it forms on a resistance level, it is capable of sending the price downward.
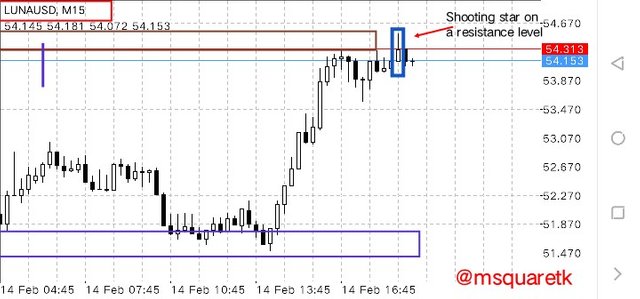
Screenshot From Mt4 App
Now, I could have entered on M15 timeframe, but I decided to also go lower to M5 timeframe to see if I could take my entry and lower the risk. On M5 timeframe, a shooting star is also seen forming. See the screenshot below.
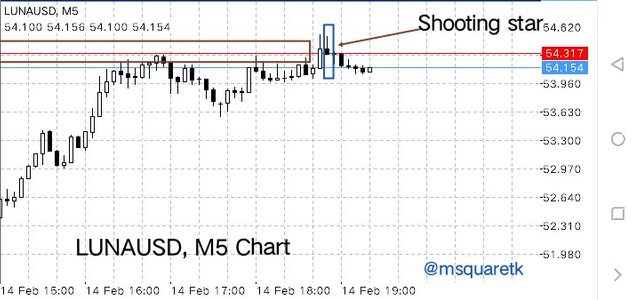
Screenshot From Mt4 App
Upon seeing that I could take my entry on M5 timeframe, having confirmed that a shooting star also formed on a resistance level , I placed an entry after the formation of the shooting star at 54.137 and stop loss was placed above the pattern at 54.860 and take profit was placed at the nearest support level at 51.660. See the screenshot below.
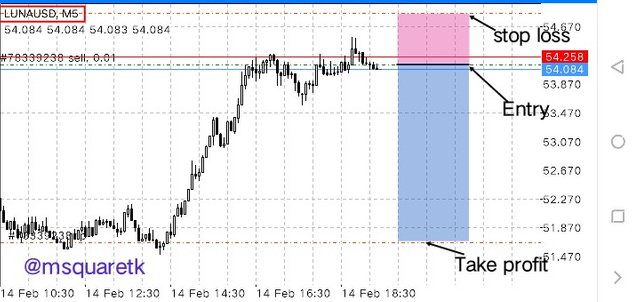
Screenshot From Mt4 App
A screenshot showing the order immediately after the execution of the instant sell order is shown below.
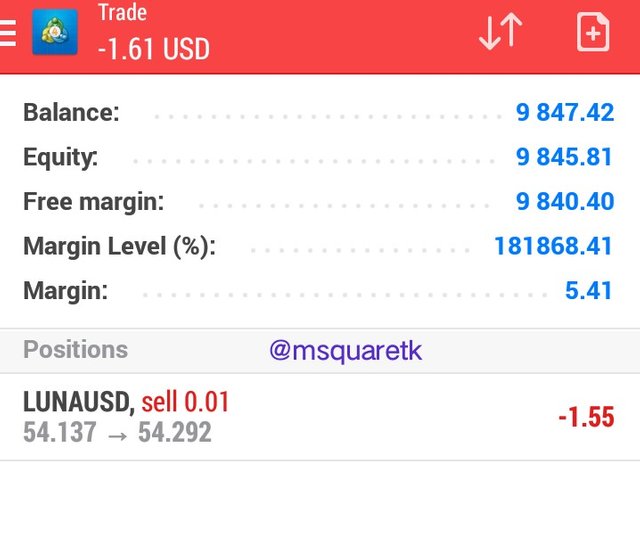
Screenshot From Mt4 App
About 2hours later after the execution of the trade, the price is already going in the predicted direction. The trade has entered profit already it's already close to the take profit. See The screenshot below.
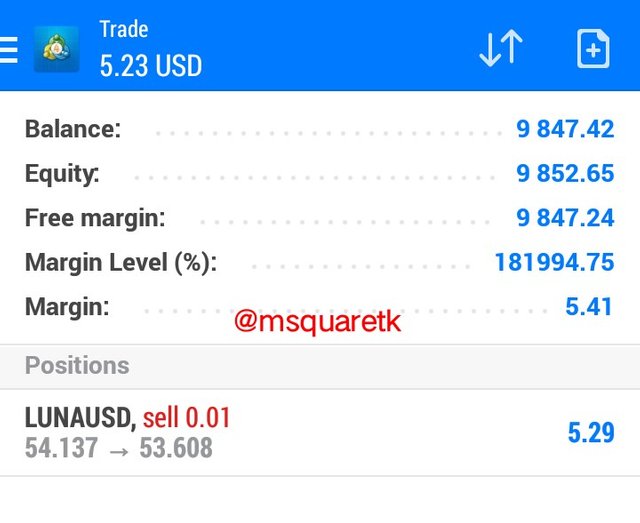
Screenshot From Mt4 App

Conclusion

Every technical analyst supposed to have the knowledge of how price action work. Price action is so useful in analysing or predicting the direction of price of an asset. Everything the traders need to analyze the market can ve seen on the chart. The historical price data which contains information about the emotions and psychology of the traders over some period of time can be seen on the chart and traders can take advantage of these information to predict the direction of price.
Japanese candlesticks chart is the most commonly used type of chart in technical analysis because of the information which are very vital it shows. Multi-timeframes analysis is very useful in technical analysis. It helps traders to filter noises and find better entry. Also, risk can be reduced greatly when traders know how to use multi timeframes very well.
Thanks to Professor @reminiscence01 for this insightful and educative lecture. I have learnt one or two things from the topic.

CC: @reminiscence01
Written by @msquaretk