STEEMIT CRYPTO ACADEMY SEASON 4-HOMEWORK POST FOR TASK 10//CANDLESTICK PATTERNS
Welcome to my task 10 post. For this task, I will be answering the question below;
IN YOUR OWN WORDS, EXPLAIN CANDLESTICK PATTERNS AND THEIR IMPORTANCE IN CARRYING OUT EFFECTIVE TECHNICAL ANALYSIS. IN YOUR OWN WORDS, EXPLAIN THE PHYCHOLOGY
BEHIND THE FORMATION OF THE FOLLOWING CANDLE STICK PATTERNS; DOJI, BULLISH ENGULFING, HAMMER, MORNING AND EVENING STAR AND THE HARAMI CANDLESTICK PATTERNS.
Let's begin!
IN YOUR OWN WORDS, EXPLAIN CANDLESTICK PATTERNS
Candlestick patterns are graphical representations of price movements. We all know the ordinary candle that we use for light when power blacks out, right? So just imagine that candle and how it is formed. It has a tail that extends from the top to the bottom, then it has a body which is in form of solidified wax.
Candlestick patterns have the same appearance.
A candlestick pattern represents the high and low price; it also shows the opening and closing prices of the trading day: all these things put together are what form a candlestick pattern.
We used an example of an ordinary candle earlier, let's closely relate it to the candlestick patterns in order for us to get a better understanding of the concept.
An ordinary candle has a tail which gives us light when power blacks out. It is that light that enables us to see what is going on around us. The tail of a candlestick pattern in this case is referred to as a shadow/wick. The shadow shows the investors the highest and lowest prices. So investor can "see" how their stocks are gaining or losing value.
Back to the ordinary candle; it has a body which is in form of solidified wax. The body is what holds the tail in place. Therefore, without the body, we donot have the tail. And just like that, candlestick patterns also have bodies. The body will show the open and close prices of the trading day. In other words, the body will show an investor the distance between the opening and closing prices for the day. We are able to establish a high or low price basing on the distance between the opening and closing prices. Hereby establishing the fact that without the body, we donot have the shadow.

Image source
TECHNICAL TERMS
Below am going to briefly talk about some technical terms that we are going to talk about alot in learning about candlestick patterns so it is important to understand them.
•BEARS
These are investors who sell their shares or stocks because they believe that the market is going to turn negative. They make their selling decision basing on the expectation of the market receding.
•BULLS
These ate investors who buy more shares or stocks because they believe that the market is going to rise. Their decision is based on economic soundness.
•UPTREND
It is a situation where the prices of assets have been rising and so have their value.
•DOWNTREND
This is a situation where the prices of assets have been falling and so have their value.
THE IMPORTANCE OF CANDLESTICK PATTERNS IN CARRYING OUT EFFECTIVE TECHNICAL ANALYSIS.
Candlestick patterns are very important in carrying g out technical analysis and this is how;
✓They are easy to read
An investor can tell by looking at the candlestick what kind of market they are dealing in. This can be done in simply looking at things like the color of the candlestick.
For example, a red/black candlestick implies a bearish market. This means that the prices opened, the bears pushed the prices down and they closed at a price lower than the opening price (opening price is higher than closing price).
A white/green candle on the other hand shows a bullish market. This means that prices opened, the bulls pushed the prices up and closed at a price higher than the opening price thus the opening price is lower than the closing price.
✓They tell investors when to buy and sell
By simply looking at the color of the candlesticks, investors know when the appropriate time is to buy or sell their stock. This is because, a red candlestick symbolizes market weakness (bearish) while a green candlestick symbolizes market strength. Therefore, investor know that it is wiser to buy on a green candle day and sell on a red candle day.
✓ They enable traders to know the market position and assert whether the market is becoming strong or weak. How? A bullish candle shows market strength while a bearish candle shows market weakness. Therefore, investors know when the right time is for them to buy or sell their assets.
IN YOUR OWN WORDS, EXPLAIN THE PHYCOLOGY BEHIND THE FORMATION OF THE FOLLOWING CANDLESTICK PATTERNS.
DOJI CANDLESTICK PATTERN
It represents indecision in the market. It is formed when the opening and close prices are almost equal. This happens because both the bulls and bears are fighting to have control over the market but none of the is succeeding in doing so.
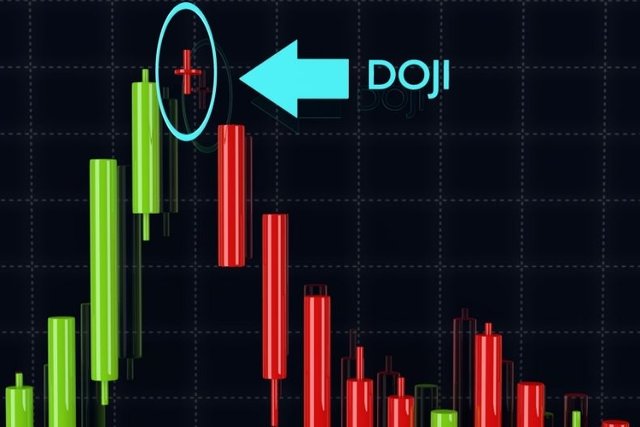
Image source
As you can see in the image above, the doji candlestick has a small real body and a long shadow(almost like a cross). The bulls push prices up while the bears push prices down, in so doing, the price falls in between (neither high, nor low) thus the small real body forming.
THE HAMMER CANDLESTICK PATTERN
It is a single candlestick pattern that is formed at the end of a downtrend and signals a bullish reversal. As you can see in the image below, the real body is small and is located at the top with and the lower shadow is twice the real body. You will also notice that has either a small or no upper shadow. All this put together, this candlestick appears like a real-life hammer and this is how it gets its name from.
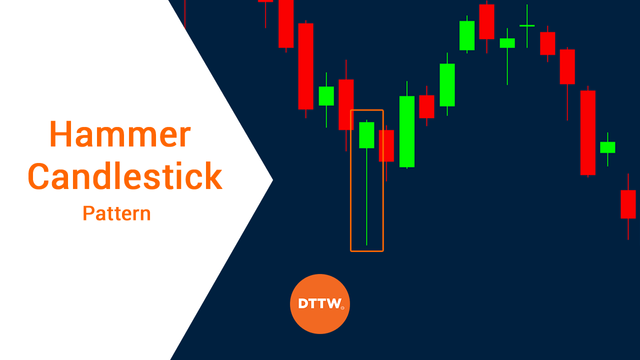
Image source
The hammer candlestick comes into formation as a result of prices opening, the bears come into the market and push those prices down. However, the bulls come into play and push the prices up hence closing the trading session with the closing price being more than the opening price.
BULLISH ENGULFING
This is a multiple candlestick pattern that is formed after a downtrend and it indicated a bullish reversal. The first candlestick is a bearish candle which indicates the continuation of the downtrend. The second is a long bullish candle that indicates that the bulls are back in the market.
As you can see in the image below, the second candlestick (which is bullish) completely engulfs/covers the first. This is where the name bullish engulfing comes from.
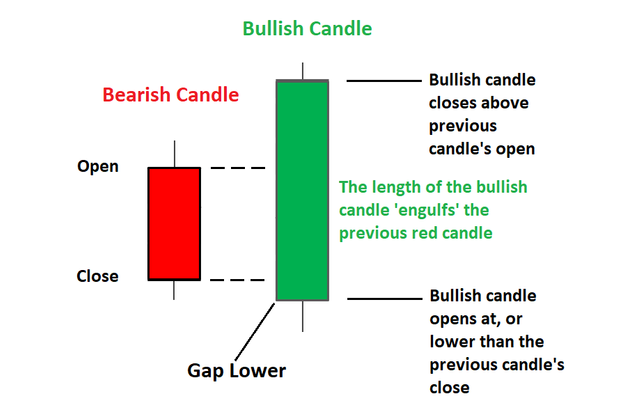
Image source
This is how the formation of the bullish engulfing candlestick comes about;
On the day before the bullish engulfing forms, the market keeps moving lower hence forming a red candle. On the next day, there is sudden buying interest; the bulls enter the market and drive prices to close higher than those of the previous day hence forming a green candle. Thus, the bulls are successful in restricting prices from falling any further. That being said, it is advisable for investors to buy stocks after such a movement because the bullishness of the market is expected to continue for a few more trading sessions.
THE MORNING STAR
It is a multiple candlestick pattern that is formed after a downtrend and indicates a bullish reversal. It is made up of three candlesticks namely; a bearish candle which represents a downtrend, a doji which indicates indecision and a bullish candle which indicates that the bulls are back in the market. As you will notice in the image below, the first and second candlestick shouldn't overlap eachother.
Interestingly, when we take the second candle out of the picture, the relationship between the first and third will be that of a bullish engulfing.
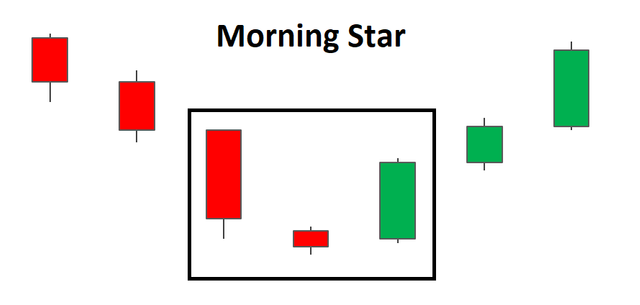
Image source
This is how the morning star comes to form;
When the first candle forms, the bearish sentiment holds and when the second one is formed, the market sees another bearish day as the gap goes down alot. This forces the bulls to apply more pressure inorder for them to stop the bears from pushing the prices further down. The market closes around where it opened thus forming a doji. On the third day, the bulls keep pushing for prices to go up and they succeed in taking control. You will notice that the market gap goes up and thus we get a bullish candle.
THE EVENING STAR
It is also a multiple candlestick pattern but it is formed after an uptrend indicating a bearish reversal. It is made up of three candlesticks namely; a bullish, doji and a bearish.
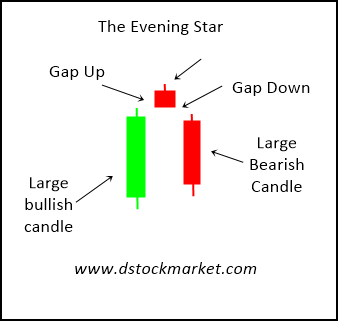
Image source
The formation of the evening star candlestick pattern is not that different from that of the morning star. The only difference is the positioning of the first and third candles.
The market has been in an uptrend and so on day one, the bullish sentiment still holds. On day two, the bears push for prices to go down and the market ends up closing around where it opened thus a doji is formed. On day three, the bears manage to take control over the market and the market gap goes down hence forming a bearish candle.
THE BEARISH HARAMI
This is also a multiple candle that is formed after an uptrend and indicates a bearish reversal. It has two candlesticks; the first is a tall bullish candle and the second is a small bearish candle.
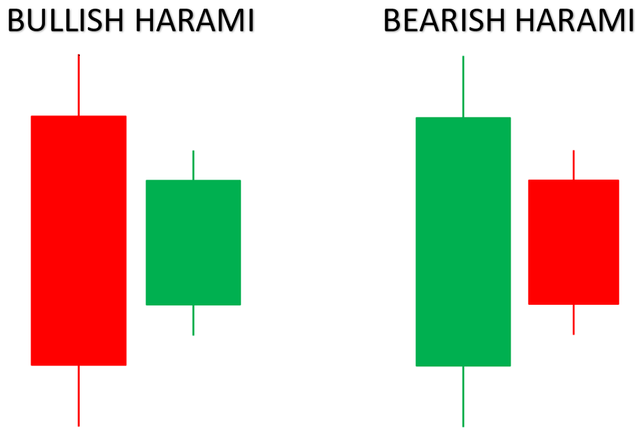
Image source
A bearish harami will appear at resistance to indicate that the trade is moving bearish.
On day one, the bullish sentiment still holds because the market has been in an uptrend. However, on day two, the bears come into the market and succeed in pushing the prices down thus forming a bearish candle.
CONCLUSION
Candlestick patterns are an important technical analysis tool and they are easy to read.
CC;
Professors,
@dilchamo
@sapwood
@reminiscence01
You have been curated by @yohan2on, a country representative (Uganda). We are curating using the steemcurator04 curator account to support steemians in Africa.
Keep creating good content on Steemit.
Always follow @ steemitblog for updates on steemit